
Machine Learning Prediction of Length of Stay in Adult Spinal Deformity Patients Undergoing Posterior Spine Fusion Surgery

Abstract
:1. Introduction
2. Methods
3. Results
4. Discussion
5. Conclusions
Author Contributions
Funding
Institutional Review Board Statement
Informed Consent Statement
Data Availability Statement
Conflicts of Interest
References
- Huang, A.; Ryu, J.J.; Dervin, G. Cost savings of outpatient versus standard inpatient total knee arthroplasty. Can. J. Surg. 2017, 60, 57–62. [Google Scholar] [CrossRef] [PubMed]
- Boylan, M.R.; Riesgo, A.M.; Chu, A.; Paulino, C.B.; Feldman, D.S. Costs and complications of increased length of stay following adolescent idiopathic scoliosis surgery. J. Pediatr. Orthop. Part B 2019, 28, 27–31. [Google Scholar] [CrossRef] [PubMed]
- Elsamadicy, A.A.; Koo, A.B.; Kundishora, A.J.; Chouairi, F.; Lee, M.; Hengartner, A.; Camara-Quintana, J.; Kahle, K.T.; DiLuna, M.L. Impact of patient and hospital-level risk factors on extended length of stay following spinal fusion for adolescent idiopathic scoliosis. J. Neurosurg. Pediatr. 2019, 24, 469–475. [Google Scholar] [CrossRef]
- McCarthy, I.M.; Hostin, R.A.; O’Brien, M.F.; Fleming, N.S.; Ogola, G.; Kudyakov, R.; Richter, K.M.; Saigal, R.; Berven, S.H.; Ames, C.P. Analysis of the direct cost of surgery for four diagnostic categories of adult spinal deformity. Spine J. 2013, 13, 1843–1848. [Google Scholar] [CrossRef]
- Phan, K.; Kim, J.; Di Capua, J.; Lee, N.J.; Kothari, P.; Dowdell, J.; Overley, S.C.; Guzman, J.Z.; Cho, S.K. Impact of Operation Time on 30-Day Complications After Adult Spinal Deformity Surgery. Glob. Spine J. 2017, 7, 664–671. [Google Scholar] [CrossRef] [PubMed]
- Klineberg, E.O.; Passias, P.G.; Jalai, C.M.; Worley, N.; Sciubba, D.M.; Burton, D.C.; Gupta, M.C.; Soroceanu, A.; Zebala, L.P.; Mundis, G.M.; et al. Predicting extended length of hospital stay in an adult spinal deformity surgical population. Spine 2016, 41, E798–E805. [Google Scholar] [CrossRef] [PubMed] [Green Version]
- Pitter, F.T.; Lindberg-Larsen, M.; Pedersen, A.B.; Dahl, B.; Gehrchen, M. Readmissions, Length of Stay, and Mortality After Primary Surgery for Adult Spinal Deformity. Spine 2019, 44, E107–E116. [Google Scholar] [CrossRef]
- ACS National Surgical Quality Improvement Program. Available online: https://www.facs.org/quality-programs/acs-nsqip (accessed on 20 August 2020).
- Beretta, L.; Santaniello, A. Nearest neighbor imputation algorithms: A critical evaluation. BMC Med. Inform. Decis. Mak. 2016, 16 (Suppl. 3), 197–208. [Google Scholar] [CrossRef] [Green Version]
- Hu, Y.J.; Ku, T.H.; Jan, R.H.; Wang, K.; Tseng, Y.C.; Yang, S.F. Decision tree-based learning to predict patient controlled analgesia consumption and readjustment. BMC Med. Inform. Decis. Mak. 2012, 12, 131. [Google Scholar] [CrossRef] [Green Version]
- Alam, M.Z.; Rahman, M.S.; Rahman, M.S. A Random Forest based predictor for medical data classification using feature ranking. Inform. Med. Unlocked 2019, 15, 100180. [Google Scholar] [CrossRef]
- Deng, H.; Urman, R.; Gilliland, F.D.; Eckel, S.P. Understanding the importance of key risk factors in predicting chronic bronchitic symptoms using a machine learning approach. BMC Med. Res. Methodol. 2019, 19, 70. [Google Scholar] [CrossRef]
- Zhang, Z.; Zhao, Y.; Canes, A.; Steinberg, D.; Lyashevska, O. Predictive analytics with gradient boosting in clinical medicine. Ann. Transl. Med. 2019, 7, 152. [Google Scholar] [CrossRef] [PubMed]
- Varoquaux, G.; Buitinck, L.; Louppe, G.; Grisel, O.; Pedregosa, F.; Mueller, A. Scikit-learn: Machine Learning without Learning the Machinery. GetMob. Mob. Comput. Commun. 2015, 19, 29–33. [Google Scholar] [CrossRef]
- Hajian-Tilaki, K. Receiver operating characteristic (ROC) curve analysis for medical diagnostic test evaluation. Casp. J. Intern. Med. 2013, 4, 627–635. [Google Scholar]
- Obuchowski, N.A.; Bullen, J.A. Receiver operating characteristic (ROC) curves: Review of methods with applications in diagnostic medicine. Phys. Med. Biol. 2018, 63, 07TR01. [Google Scholar] [CrossRef] [PubMed]
- Liao, P.; Wu, H.; Yu, T. ROC Curve Analysis in the Presence of Imperfect Reference Standards. Stat. Biosci. 2017, 9, 91–104. [Google Scholar] [CrossRef]
- Rufibach, K. Use of Brier score to assess binary predictions. J. Clin. Epidemiol. 2010, 63, 938–939. [Google Scholar] [CrossRef]
- Shields, L.B.; Clark, L.; Glassman, S.D.; Shields, C.B. Decreasing hospital length of stay following lumbar fusion utilizing multidisciplinary committee meetings involving surgeons and other caretakers. Surg. Neurol. Int. 2017, 8, 5. [Google Scholar] [CrossRef]
- Ansari, S.F.; Yan, H.; Zou, J.; Worth, R.M.; Barbaro, N.M. Hospital Length of Stay and Readmission Rate for Neurosurgical Patients. Neurosurgery 2018, 82, 173–181. [Google Scholar] [CrossRef] [PubMed] [Green Version]
- Gruskay, J.A.; Fu, M.; Bohl, D.D.; Webb, M.L.; Grauer, J.N. Factors affecting length of stay after elective posterior lumbar spine surgery: A multivariate analysis. Spine J. 2015, 15, 1188–1195. [Google Scholar] [CrossRef] [PubMed]
- Linzey, J.R.; Kahn, E.N.; Shlykov, M.A.; Johnson, K.T.; Sullivan, K.; Pandey, A.S. Length of Stay Beyond Medical Readiness in Neurosurgical Patients: A Prospective Analysis. Neurosurgery 2019, 85, E60–E65. [Google Scholar] [CrossRef] [PubMed] [Green Version]
- Florkowski, C.M. Sensitivity, Specificity, Receiver-Operating Characteristic (ROC) Curves and Likelihood Ratios: Communicating the Performance of Diagnostic Tests. Clin. Biochem. Rev. 2008, 29 (Suppl. 1), S83–S87. Available online: http://www.ncbi.nlm.nih.gov/pubmed/18852864 (accessed on 4 January 2021).
- Biron, D.R.; Sinha, I.; Kleiner, J.E.; Aluthge, D.P.; Goodman, A.D.; Sarkar, I.N.; Cohen, E.; Daniels, A.H. A Novel Machine Learning Model Developed to Assist in Patient Selection for Outpatient Total Shoulder Arthroplasty. J. Am. Acad. Orthop. Surg. 2019, 28, e580–e585. [Google Scholar] [CrossRef] [PubMed]
- Navarro, S.M.; Wang, E.Y.; Haeberle, H.S.; Mont, M.A.; Krebs, V.E.; Patterson, B.; Ramkumar, P.N. Machine Learning and Primary Total Knee Arthroplasty: Patient Forecasting for a Patient-Specific Payment Model. J. Arthroplast. 2018, 33, 3617–3623. [Google Scholar] [CrossRef] [PubMed]
- Durand, W.M.; DePasse, J.M.; Daniels, A.H. Predictive Modeling for Blood Transfusion Following Adult Spinal Deformity Surgery. Spine 2018, 43, 1058–1066. [Google Scholar] [CrossRef]
- Fontana, M.A.; Lyman, S.; Sarker, G.K.; Padgett, D.E.; MacLean, C.H. Can machine learning algorithms predict which patients will achieve minimally clinically important differences from total joint arthroplasty? In Clinical Orthopaedics and Related Research; Lippincott Williams and Wilkins: Philadelphia, PA, USA, 2019; Volume 477, pp. 1267–1279. [Google Scholar] [CrossRef] [Green Version]
- Goyal, A.; Ngufor, C.; Kerezoudis, P.; McCutcheon, B.; Storlie, C.; Bydon, M. Can machine learning algorithms accurately predict discharge to nonhome facility and early unplanned readmissions following spinal fusion? Analysis of a national surgical registry. J. Neurosurg. Spine 2019, 31, 568–578. [Google Scholar] [CrossRef] [PubMed]
- Malik, A.T.; Khan, S.N. Predictive modeling in spine surgery. Ann. Transl. Med. 2019, 7, S173. [Google Scholar] [CrossRef]
- Kobayashi, K.; Ando, K.; Kato, F.; Kanemura, T.; Sato, K.; Hachiya, Y.; Matsubara, Y.; Kamiya, M.; Sakai, Y.; Yagi, H.; et al. Predictors of Prolonged Length of Stay After Lumbar Interbody Fusion: A Multicenter Study. Glob. Spine J. 2019, 9, 466–472. [Google Scholar] [CrossRef] [Green Version]
- Adogwa, O.; Lilly, D.T.; Khalid, S.; Desai, S.A.; Vuong, V.D.; Davison, M.A.; Ouyang, B.; Bagley, C.A.; Cheng, J. Extended Length of Stay After Lumbar Spine Surgery: Sick Patients, Postoperative Complications, or Practice Style Differences Among Hospitals and Physicians? World Neurosurg. 2019, 123, e734–e739. [Google Scholar] [CrossRef]
- Kim, B.D.; Hsu, W.K.; De Oliveira, G.S.; Saha, S.; Kim, J.Y.S. Operative duration as an independent risk factor for postoperative complications in single-level lumbar fusion: An analysis of 4588 surgical cases. Spine 2014, 39, 510–520. [Google Scholar] [CrossRef]
- Dibra, F.F.; Silverberg, A.J.; Vasilopoulos, T.; Gray, C.F.; Parvataneni, H.K.; Prieto, H.A. Arthroplasty Care Redesign Impacts the Predictive Accuracy of the Risk Assessment and Prediction Tool. J. Arthroplast. 2019, 34, 2549–2554. [Google Scholar] [CrossRef] [PubMed]
- Pitt, H.A.; Kilbane, M.; Strasberg, S.M.; Pawlik, T.M.; Dixon, E.; Zyromski, N.J.; Aloia, T.A.; Henderson, J.M.; Mulvihill, S.J. ACS-NSQIP has the potential to create an HPB-NSQIP option. HPB 2009, 11, 405–413. [Google Scholar] [CrossRef] [PubMed] [Green Version]
- Lieber, R.L. Statistical significance and statistical power in hypothesis testing. J. Orthop. Res. 1990, 8, 304–309. [Google Scholar] [CrossRef] [PubMed]


| Short LOS | Long LOS | p-Value | |
|---|---|---|---|
| % Male | 360 (34.88%) | 85 (32.44%) | 0.46 |
| Caucasian | 794 (76.94%) | 156 (59.54%) | <0.0001 |
| ASA > 2 | 530 (51.36%) | 210 (80.15%) | <0.0001 |
| Steroid | 44 (4.26%) | 20 (7.63%) | 0.02 |
| Smoke | 159 (15.41%) | 42 (16.03%) | 0.8 |
| BMI | 27.3 | 28.5 | 0.01 |
| Work RVU | 28.9 | 32 | <0.0001 |
| Age (years) | 51.3 | 57.5 | <0.0001 |
| Operation Time (minutes) | 321 | 440.5 | <0.0001 |
| WBC | 7.1 | 7.4 | 0.18 |
| CREAT | 0.9 | 0.9 | 0.3 |
| PLATE | 252.5 | 249 | 0.49 |
| HCT | 40.3 | 38.9 | <0.0001 |
| BUN | 15.3 | 16.3 | 0.03 |
| SODM | 139.2 | 138.5 | <0.0001 |
| ALKPH | 83.9 | 89.6 | 0.06 |
| LOS | 4.5 | 15.3 | <0.0001 |
| Total | 1032 | 262 |
| AUC | Prediction Accuracy (%) | Brier | |
|---|---|---|---|
| LR | 0.814 | 83.1% | 0.13 |
| DT | 0.566 | 68.4% | 0.29 |
| RF | 0.821 | 78.5% | 0.14 |
| XGB | 0.736 | 73.1% | 0.20 |
| GB | 0.782 | 80.8% | 0.14 |
| Posterior | ||||
|---|---|---|---|---|
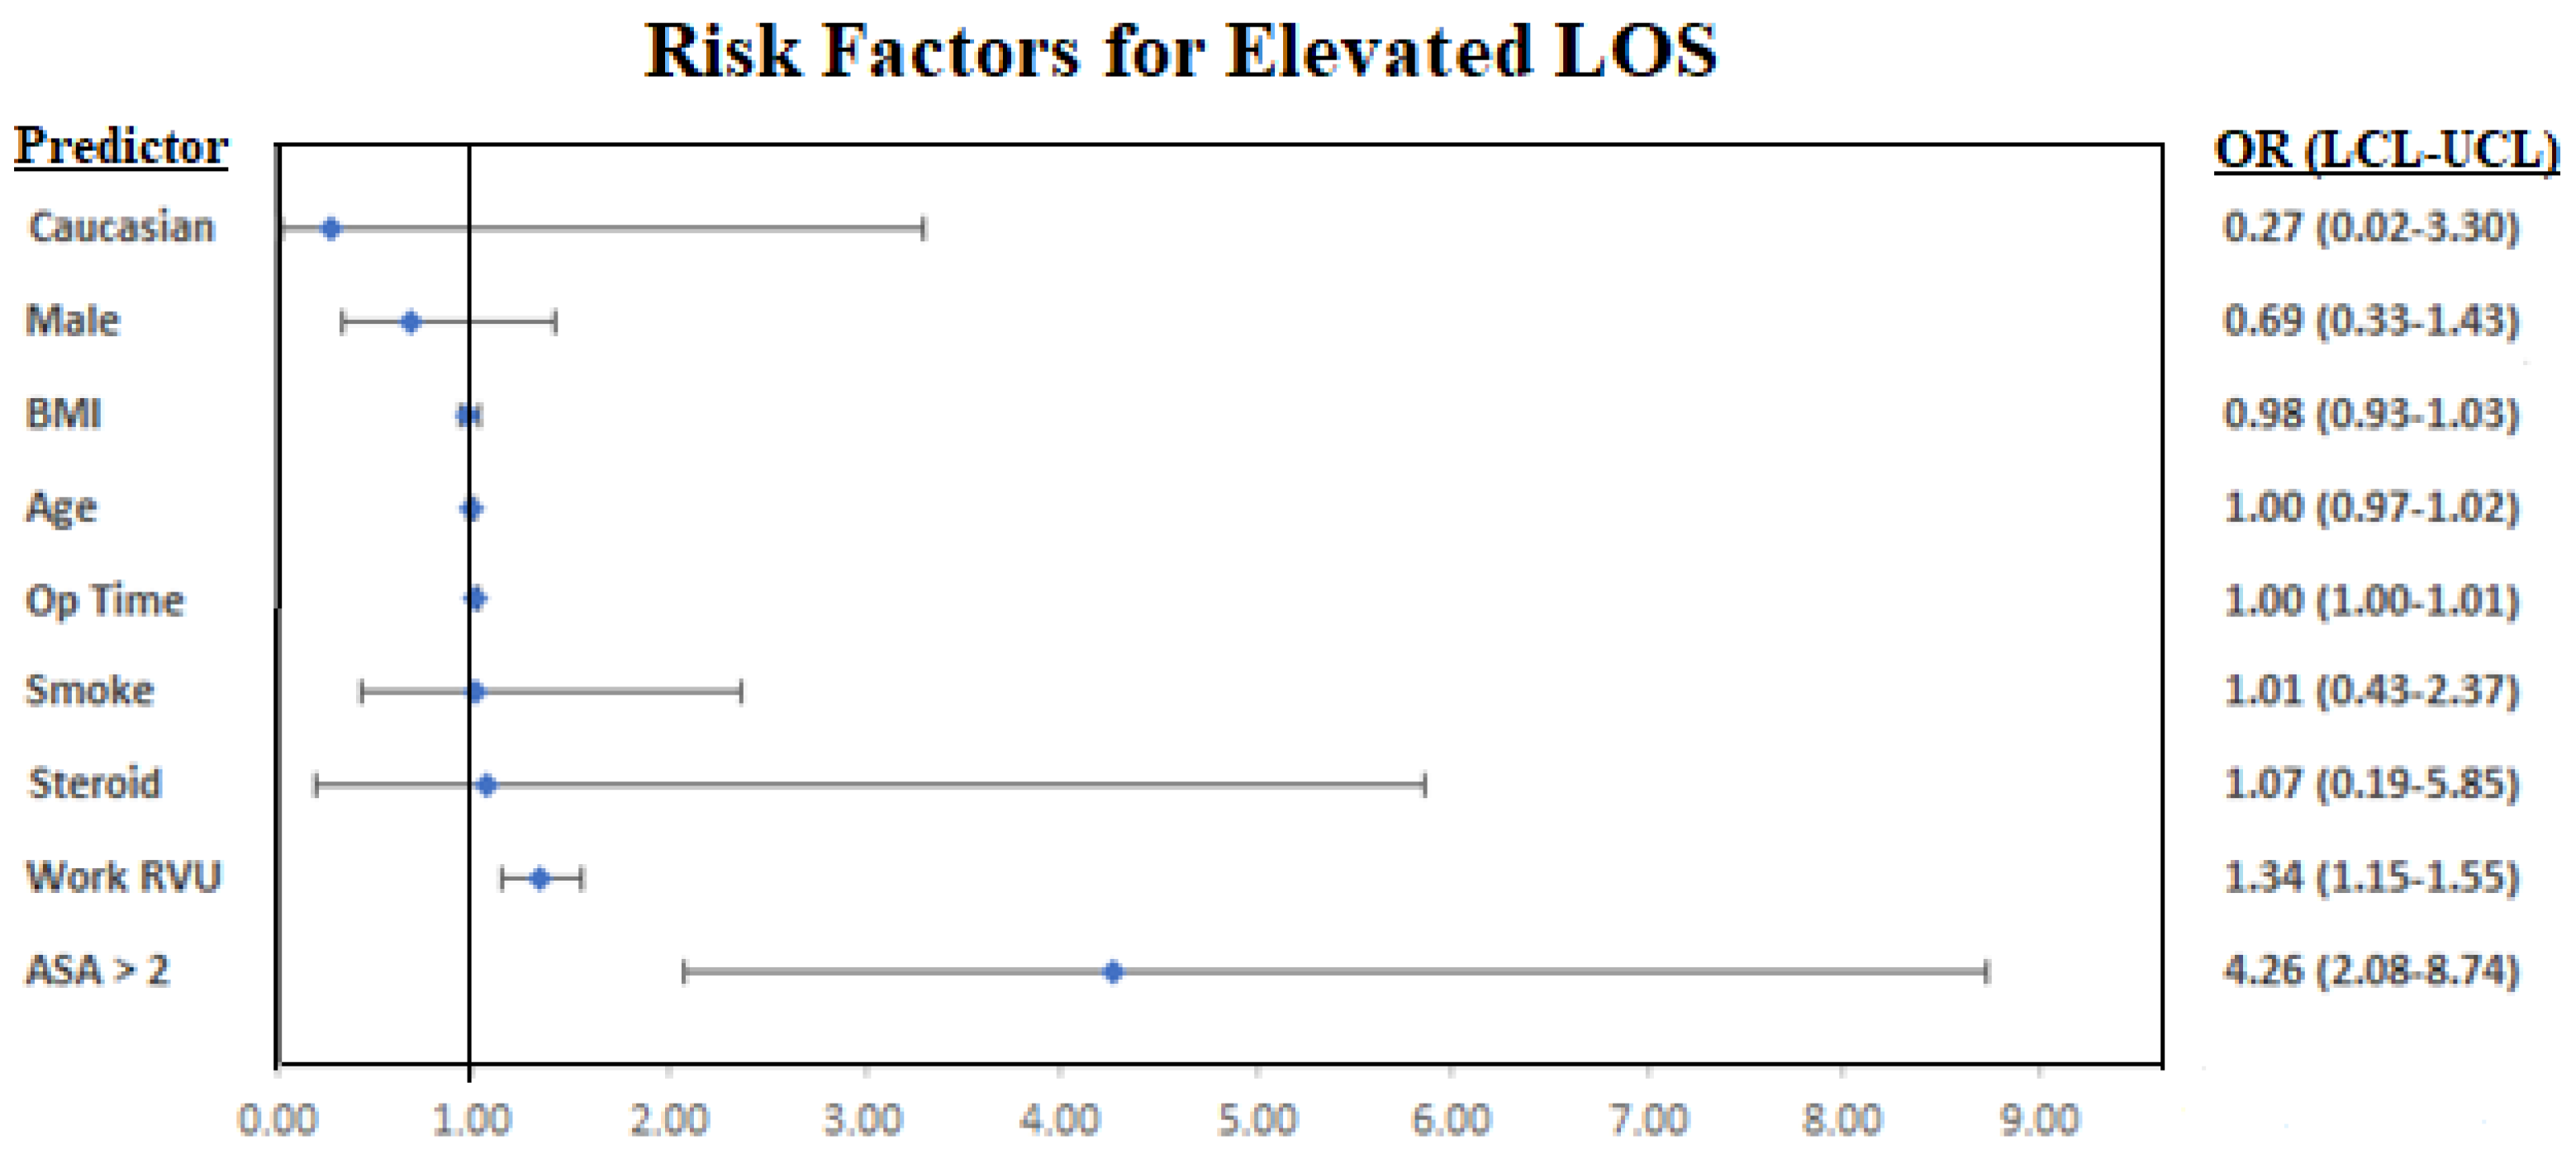
| Odds Ratio | Lower | Upper | p-Value | |
| BMI | 0.98 | 0.93 | 1.03 | 0.49 |
| Work RVU | 1.34 | 1.15 | 1.55 | <0.001 |
| Age | 1.00 | 0.97 | 1.02 | 0.71 |
| Male | 0.69 | 0.33 | 1.43 | 0.32 |
| Caucasian | 0.27 | 0.02 | 3.30 | 0.31 |
| ASA > 2 | 4.26 | 2.08 | 8.74 | <0.001 |
| Steroid | 1.07 | 0.19 | 5.85 | 0.94 |
| Smoke | 1.01 | 0.43 | 2.37 | 0.98 |
| Op Time | 1.00 | 1.00 | 1.01 | <0.001 |
| WBC | 1.02 | 0.86 | 1.22 | 0.82 |
| CREAT | 0.42 | 0.08 | 2.12 | 0.29 |
| PLATE | 1.00 | 1.00 | 1.01 | 0.29 |
| HCT | 0.95 | 0.88 | 1.03 | 0.20 |
| BUN | 1.01 | 0.95 | 1.08 | 0.74 |
| SODM | 1.04 | 0.93 | 1.17 | 0.50 |
| ALKPH | 1.00 | 0.99 | 1.01 | 0.84 |
Publisher’s Note: MDPI stays neutral with regard to jurisdictional claims in published maps and institutional affiliations. |
© 2021 by the authors. Licensee MDPI, Basel, Switzerland. This article is an open access article distributed under the terms and conditions of the Creative Commons Attribution (CC BY) license (https://creativecommons.org/licenses/by/4.0/).
Share and Cite
Zhang, A.S.; Veeramani, A.; Quinn, M.S.; Alsoof, D.; Kuris, E.O.; Daniels, A.H. Machine Learning Prediction of Length of Stay in Adult Spinal Deformity Patients Undergoing Posterior Spine Fusion Surgery. J. Clin. Med. 2021, 10, 4074. https://doi.org/10.3390/jcm10184074
Zhang AS, Veeramani A, Quinn MS, Alsoof D, Kuris EO, Daniels AH. Machine Learning Prediction of Length of Stay in Adult Spinal Deformity Patients Undergoing Posterior Spine Fusion Surgery. Journal of Clinical Medicine. 2021; 10(18):4074. https://doi.org/10.3390/jcm10184074
Chicago/Turabian StyleZhang, Andrew S, Ashwin Veeramani, Matthew S. Quinn, Daniel Alsoof, Eren O. Kuris, and Alan H. Daniels. 2021. "Machine Learning Prediction of Length of Stay in Adult Spinal Deformity Patients Undergoing Posterior Spine Fusion Surgery" Journal of Clinical Medicine 10, no. 18: 4074. https://doi.org/10.3390/jcm10184074