


ABSTRACT
Background The quality of the vertebral body structures such as endplate, cortex, and trabecular bone is important for understanding the performance of implants, particularly at the bone-implant interface. Although vertebral body structures have been analyzed separately in the literature, there is no comprehensive study to assess these anatomical measurements along with their interrelationships in the lumbar spine. Therefore, the purpose of this study was to assess variations in trabecular microstructure, vertebral endplate thickness and concavity, and vertebral body cortex thickness within the lumbar spine.
Methods A total of 80 lumbar vertebrae (L1-L5) were dissected from 16 human cadaver specimens and imaged with microcomputed tomography to determine trabecular microstructure, vertebral cortex thickness, endplate thickness, and maximum endplate concavity depth. A paired t test and regression analysis were used to determine significant differences (P < .05) between different vertebral levels and correlations between the analyzed anatomical parameters.
Results L1 vertebra had significantly better (P < .02) trabecular bone microstructure (eg, trabecular bone volume fraction) than all other lumbar vertebrae. However, L1 vertebra also had significantly thinner (P ≤ .02) anterior, left, and right cortices compared to all other vertebral levels. Within L3-L5 intervertebral disc spaces, cranial endplates had significantly greater (P ≤ .03) thickness and maximum concavity depth compared to their respective caudal endplates. No strong correlations were observed between trabecular bone microstructure, maximum endplate concavity depth, vertebral cortex, and endplate thickness parameters.
Conclusions Detailed reference data of these anatomical parameters for each lumbar vertebral body can aid in improved understanding of bone quality, particularly when assessing different implant designs and fixation approaches. Moreover, such anatomical knowledge may help clinicians with optimal implant design selection and surgical placement of these devices into their respective locations.
- endplate concavity depth
- trabecular bone microstructure
- vertebral cortex thickness
- endplate thickness
- lumbar spine
- anatomy
INTRODUCTION
The quality of vertebral structures is important for the performance of implants such as total disc replacement (TDR) and interbody cages, particularly at the bone-implant interface. For example, TDRs and interbody cages are inserted into the intervertebral space and rest on cranial and caudal vertebral endplates. However, TDR and fusion cage designs typically have flat mating surfaces that may not match the contour of the endplate, which can vary between patients. In fact, a finite element study found a more uniform stress distribution and lower contact stresses in a fusion cage that conformed to the surface compared to a fusion cage with flat (nonconforming) mating surfaces.1 Furthermore, a clinical study reported that endplate concavity plays a key role for the outcomes of total disc arthroplasty.2 These authors compared pain measures (ie, visual analog score and Oswestry Disability Index) in patients who underwent single-level TDR based on the endplate shape. They reported that patients with flat endplates had significant improvement in pain than patients with concave endplates after 2 years of follow-up. In addition, fusion procedures typically stabilize the spine segment with screws placed anteriorly or laterally into the vertebral body. These fixation approaches penetrate the vertebral body through either the endplate or the cortex and then enter into the trabecular bone. A comprehensive study to understand anatomical variations in the lumbar spine can aid future investigations that evaluate the performance of devices in their respective locations.
The anatomy of lumbar vertebrae has been extensively studied in the literature. Several of these studies focused on posterior lumbar vertebral anatomy, such as pedicles, laminae, spinous process, pars interarticularis, and articular facets,3–7 while others investigated the anterior column, such as vertebral body height, transverse process width, and endplates.8 Although trabecular bone microstructure, vertebral cortex thickness, endplate thickness, and concavity have been reported separately in previous literature, most of these studies did not analyze how these anatomical parameters vary across the lumbar spine or whether interrelationships exist.8–11 Therefore, the objective of this cadaveric study was to quantitatively assess variations in trabecular microstructure, vertebral endplate thickness and concavity, and vertebral cortex thickness within the lumbar spine.
METHODS
Samples
Fresh-frozen human cadaver specimens were procured from the National Disease Research Interchange and the Maryland State Anatomy Board. The medical history of each donor was reviewed to exclude trauma, malignancy, previous implantations, or metabolic bone disease that might otherwise compromise the anatomy of the lumbar spine. In particular, donors with severe osteophytes, Schmorl's nodes, and endplate sclerosis were excluded from the study, resulting in a total of 16 cadavers (11 male and 5 female). Lumbar spines had surrounding soft tissues (fat and musculature) removed and were scanned using DEXA (Hologic, Bedford, Massachusetts) in the anterioposterior direction to assess areal bone mineral density (BMD). A phantom was used to ensure that density was calibrated per the manufacturer's recommendation. Average lumbar BMD and t score for these cadaver specimens were 0.77 ± 0.15 g/cm2 and −2.5 ± 1.3, respectively (Table 1). A total of 80 lumbar vertebrae from L1 to L5 were studied. All vertebrae were imaged with microcomputed tomography (micro-CT, Scanco Medical, Basserdorf, Switzerland) at 51-μm isotropic voxel resolution to quantify the following vertebral body anatomy: trabecular bone microstructure, endplate thickness and concavity, and cortex thickness.
Human cadaver spine vertebrae demographic and DEXA information.
Trabecular Microstructure
Contours were manually drawn on axial slices of micro-CT images to separate cortical bone from trabecular bone. A threshold to distinguish trabecular bone from background was chosen for each donor. From these segmented images, trabecular microstructure, such as trabecular bone volume fraction (ratio of the trabecular bone volume to the total volume of the vertebral body), trabecular thickness (average thickness of trabeculae), and trabecular number (number of trabeculae), were quantified using previously published methods.12,13 In addition, volumetric bone mineral density (vBMD) was also evaluated for each vertebra based on hydroxyapatite calibration standards.
Endplate Thickness and Concavity
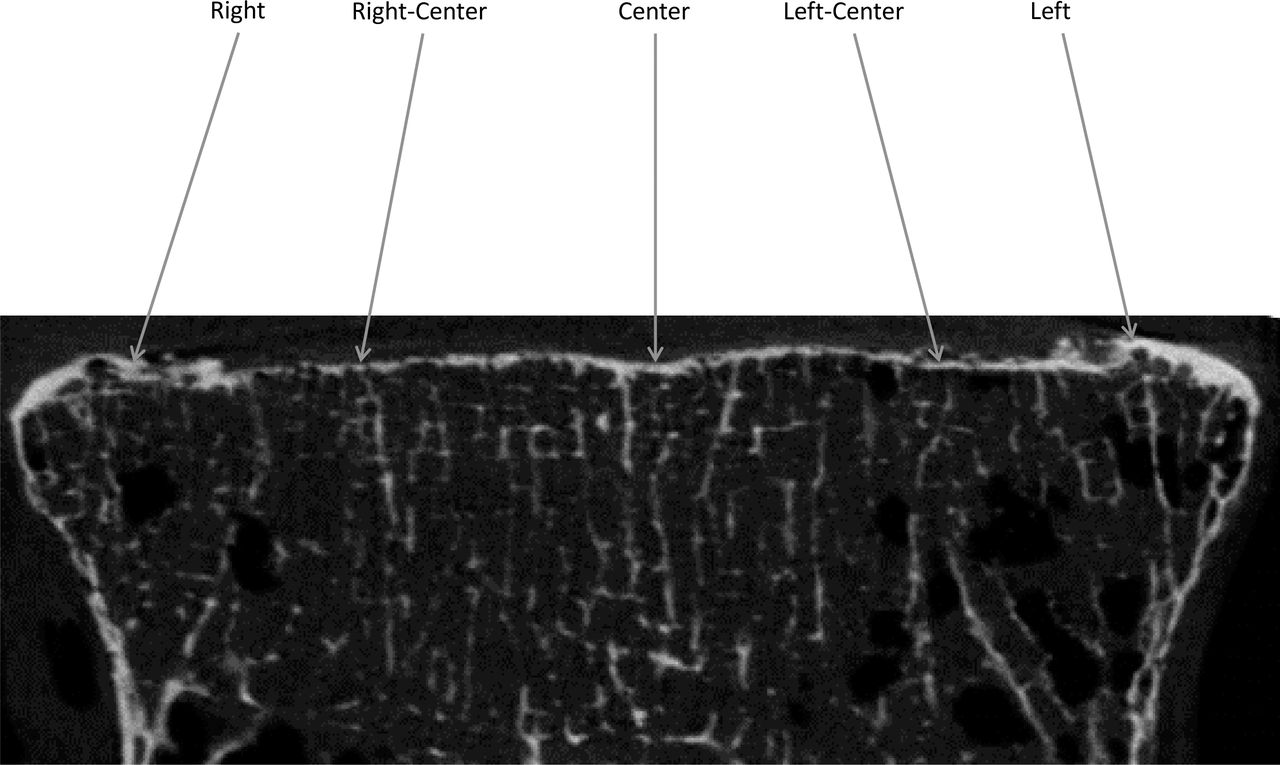
Digital Imaging and Communications in Medicine (DICOM) files of vertebrae obtained from micro-CT scans were imported into Mimics (Materialise, Leuven, Belgium). Endplate thickness measurements were taken at 5 locations across the superior and inferior endplates from the mid-coronal slice of each vertebra (Figure 1). Two measurements (right and left) were performed on the apophyseal ring, 1 at the representative location in the center of the endplate and 2 other measurements at representative locations at the right-center and left-center of the endplate. Average endplate thickness for the entire vertebra was obtained by averaging the 5 endplate thickness measurements. Additionally, an independent reviewer performed thickness measurements on endplates from each donor to determine reproducibility. The average error in endplate thickness values was 9%, indicating good reproducibility.

Endplate thickness measurements at 5 different points on endplate from the mid-coronal slice of vertebra.
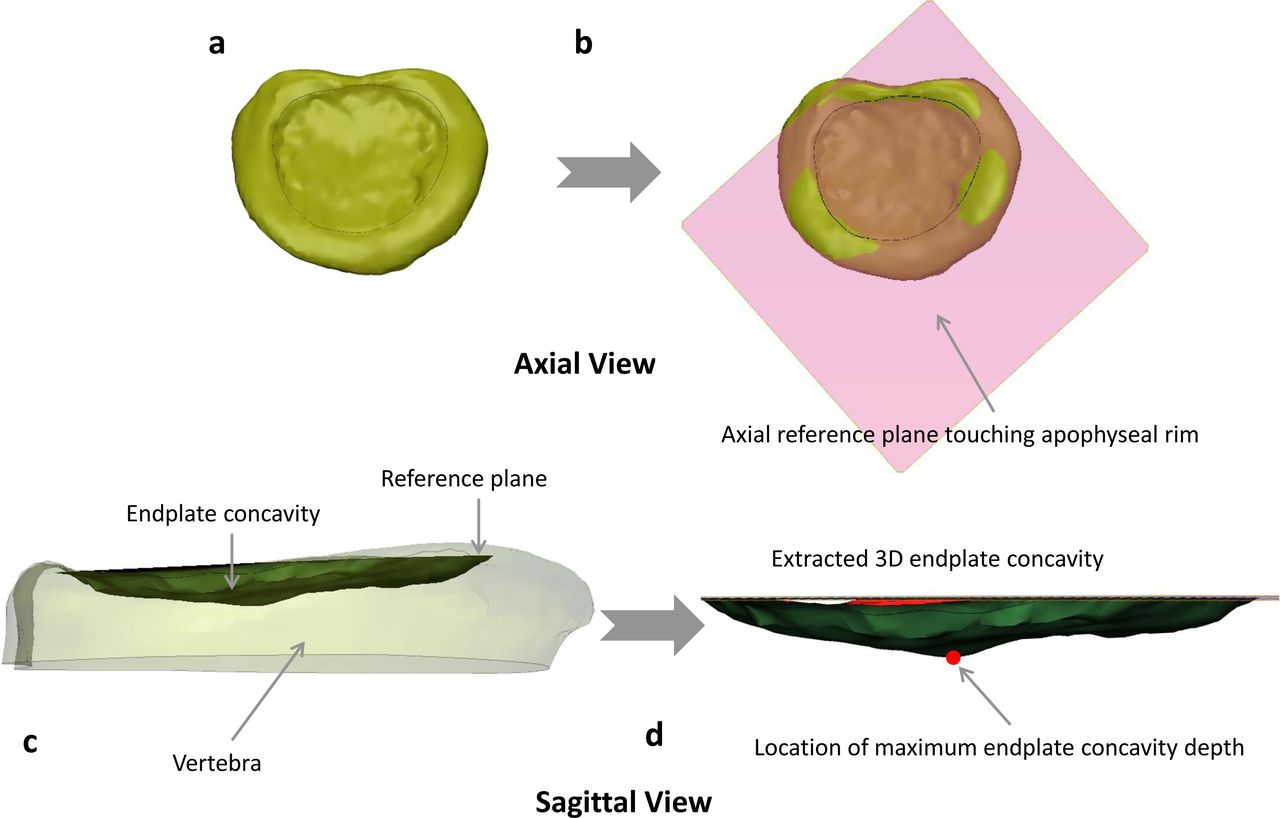
Endplate concavity was assessed using a semiautomated method. The first step was to create a 3-dimensional representation of each vertebral endplate by using thresholding and segmentation tools in Mimics (Figure 2a). The endplate structure was then exported to 3-Matic (Materialise), and an axial reference plane was created that intersected the top surface of the anterior, left, and right apophyseal rim (Figure 2b and c). This step of creating an axial plane by choosing apophyseal rim edges was the only manual step in the entire process and has less subjectivity. A 3-dimensional representation of this concavity was then created using image processing tools in the 3-Matic software. The maximum endplate concavity depth (ECD) was automatically measured as the largest vertical distance between the reference plane and the endplate surface (Figure 2d). Reproducibility of this method was checked by an independent reviewer in over half of the 160 endplates analyzed. The average error in ECD values was 6%, indicating low subjectivity and good reproducibility of this semiautomated method. The location of that maximum ECD was also assigned to 1 of 3 regions on the vertebral endplate (posterior, center, and anterior).

Axial view of (a) 3-dimensional endplate structure, (b) axial reference plane created based on 3 points on apophyseal ring, and sagittal view of (c) axial reference plane on the endplate highlighting the endplate concavity space (shaded region) and (d) endplate concavity space with location of maximum concavity depth (highlighted with red dot).
Vertebral Cortex Thickness
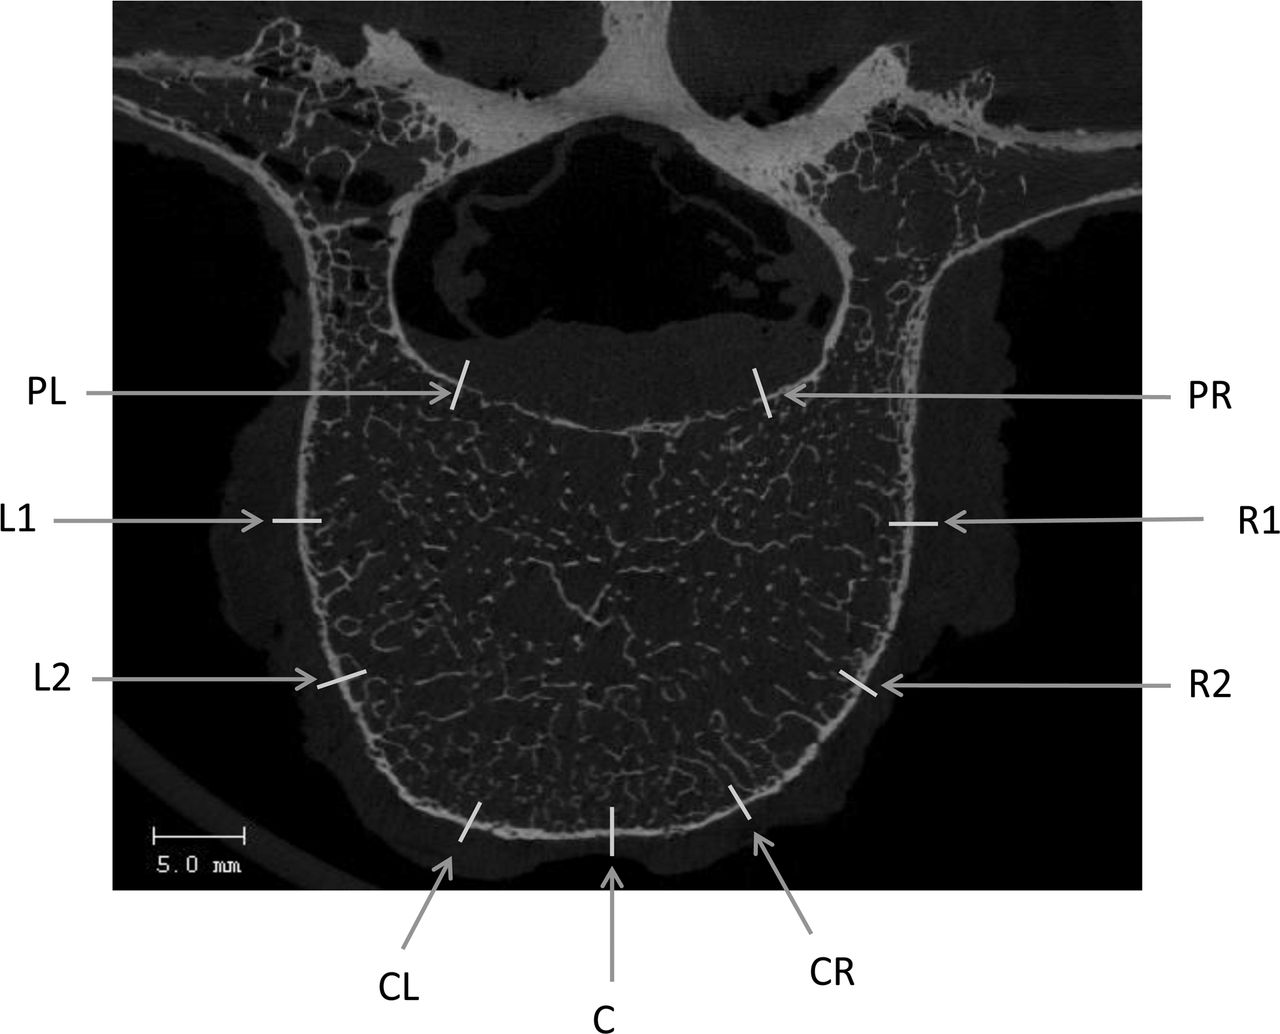
Vertebral cortex measurements were taken at 9 different locations on the cortical bone region from a mid-axial slice of each vertebral body (Figure 3). These 9 points were classified into 4 different anatomical regions by taking the average of their respective measurements: posterior (PL, PR), anterior (CR, C, CL), left (L1, L2), and right (R1, R2). An independent reviewer checked the reproducibility of this method by random selection of vertebrae for analysis. The average error in cortex thickness values was 7%, indicating good reproducibility.

Vertebral cortex thickness measurements at 9 different locations at the mid-axial slice of vertebra.
Statistical Methods
Mean and standard deviation were calculated for each parameter. A paired t test was used to determine significant differences (P ≤ .05) in bone anatomy parameters (ie, trabecular microstructure, trabecular vBMD, average endplate thickness, vertebral cortex thickness, and maximum ECD) between lumbar vertebrae. Linear regression analyses were performed to investigate interrelationships between maximum ECD and average endplate thickness, average vertebral cortex thickness (average of anterior, posterior, left, and right values) and trabecular bone volume fraction (BVF), average vertebral cortex thickness and average endplate thickness, and trabecular BVF and average endplate thickness.
RESULTS
Trabecular Microstructure
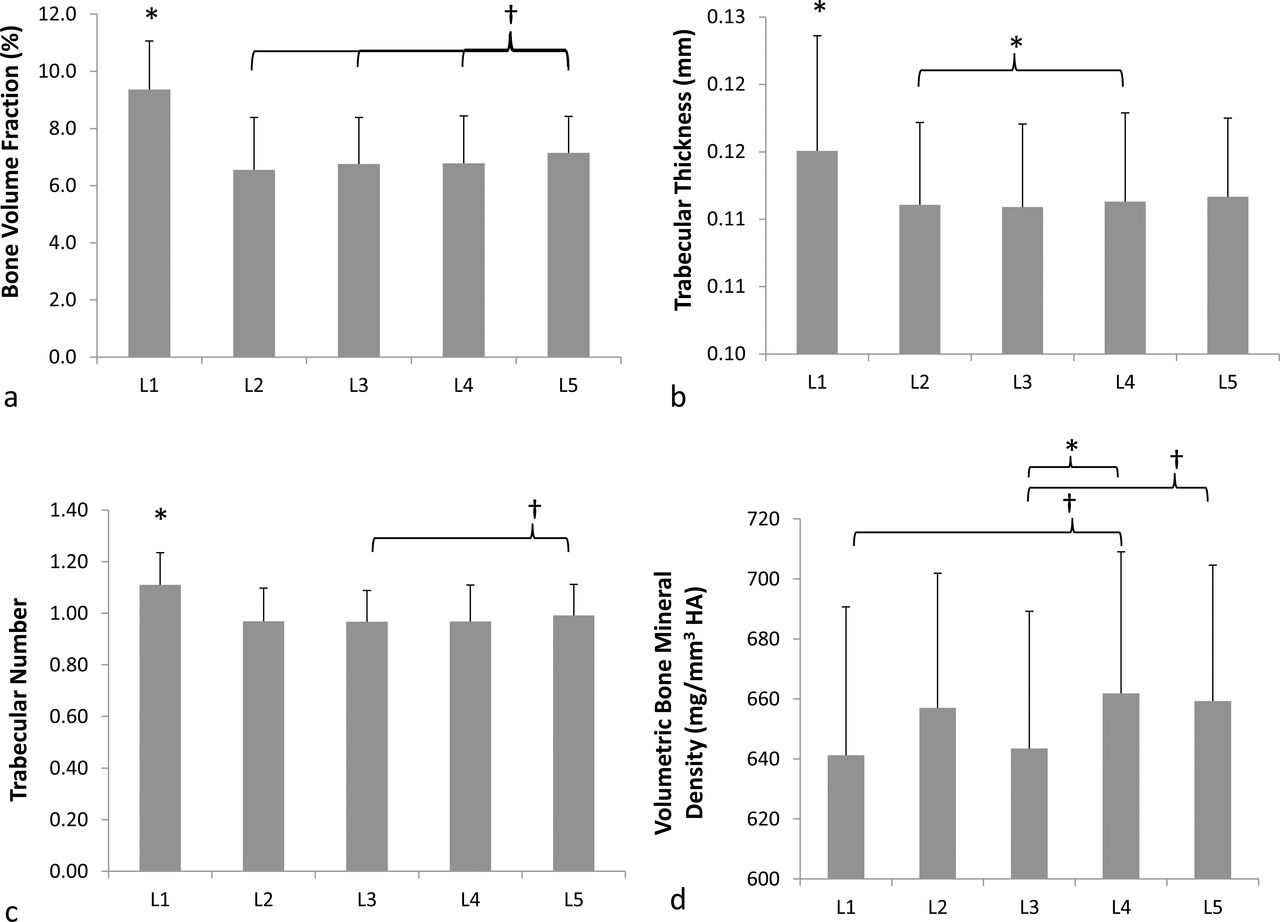
L1 vertebra had significantly better (P < .02) trabecular bone microstructure (trabecular BVF, thickness, and number) than all other lumbar vertebrae (Figure 4). L5 vertebrae had the next best microstructure with greater (P ≤ .10) bone volume fraction than all other vertebrae. Trabecular bone microstructure between other vertebral levels was similar (P ≥ .12) to each other with the exception of L4 vertebrae having significantly (P = .01) thicker trabeculae than L2 vertebrae. There was substantial variability in trabecular vBMD across vertebral levels. L4 vertebrae had greater (P ≤ .09) trabecular vBMD compared to L1 and significantly greater (P = .02) vBMD than L3 vertebrae. There were no significant differences in trabecular vBMD between other vertebral levels (P ≥ .07).

Mean and standard deviations of (a) trabecular bone volume fraction, (b) trabecular thickness, (c) trabecular number, and (d) volumetric bone mineral density for all lumbar vertebrae (*P ≤ .05; †P ≤ .1).
Endplate Thickness
Average endplate thickness was significantly greater (P = .05) for inferior endplates compared to their corresponding superior endplates in L3 and L4 vertebrae (Figure 5a). There was no difference (P ≥ .28) between inferior and superior endplates for other lumbar vertebral levels. Furthermore, L1 inferior endplates were significantly thinner (P ≤ .01) than all other inferior endplates except for L5 vertebra (Table S1; http://www.ijssurgery.com/lookup/suppl/doi:10.14444/6049/-/DC1/i2211-4599-13-4-08_s01.docx). There were no statistically significant differences (P ≥ .22) in thickness between superior endplates for all lumbar vertebral levels apart from L1 superior endplates, which were significantly thinner (P < .01) than L3 superior endplates. Within an intervertebral space, cranial endplates were significantly thicker (P ≤ .03) compared to their respective caudal endplates for L3-L4 and L4-L5 intervertebral spaces. However, cranial endplates were significantly (P = .03) thinner compared to their caudal endplates in the L1-L2 intervertebral disc space.
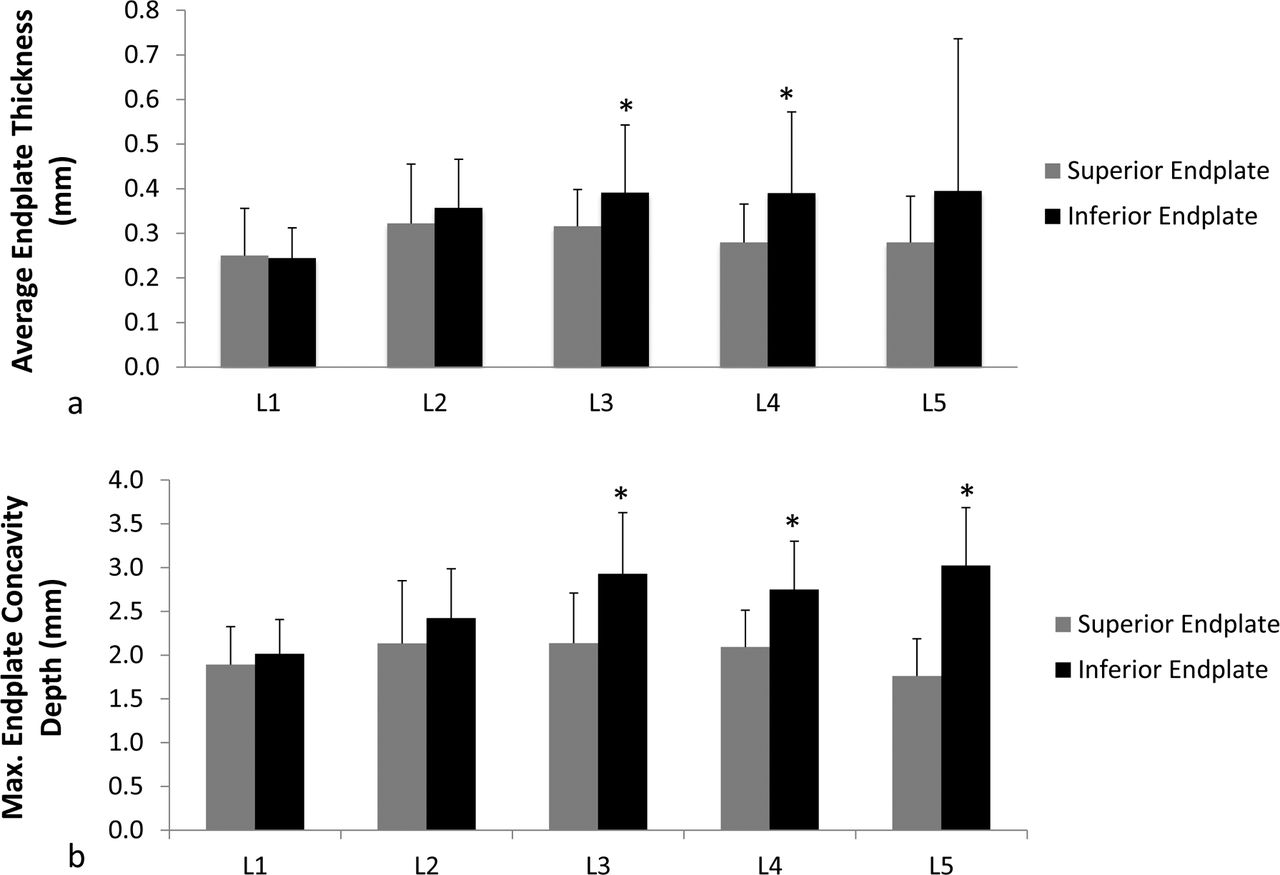
Mean and standard deviations of (a) average endplate thickness and (b) maximum endplate concavity depth in millimeters for superior and inferior endplates of all lumbar vertebrae. Student paired t test analyses were performed to obtain statistical significance between superior and inferior endplates (*P ≤ .05).
Endplate Concavity
Superior endplate ECD was lower than corresponding inferior endplate ECD for all levels; however, statistical significance (P < .01) was found only at L3, L4, and L5 levels (Figure 5b). Moreover, cranial endplates within L3-L4 and L4-L5 intervertebral disc spaces had significantly greater (P < .01) concavity depth compared to their respective caudal endplates. Concavity in inferior and superior endplates increased from L1 to L3 but either leveled off or declined after L3. Furthermore, ECD for L1 inferior endplate was significantly lower (P ≤ .01) than L2-L5 inferior endplates (Table S2; http://www.ijssurgery.com/lookup/suppl/doi:10.14444/6049/-/DC1/i2211-4599-13-4-08_s01.docx). There were no significant differences in superior endplate ECD between vertebral levels (P ≥ .09). The location of maximum ECD was found mainly in the center region of endplate (73%) followed by posterior (25%) and then anterior (2%) regions.
Vertebral Cortex Thickness
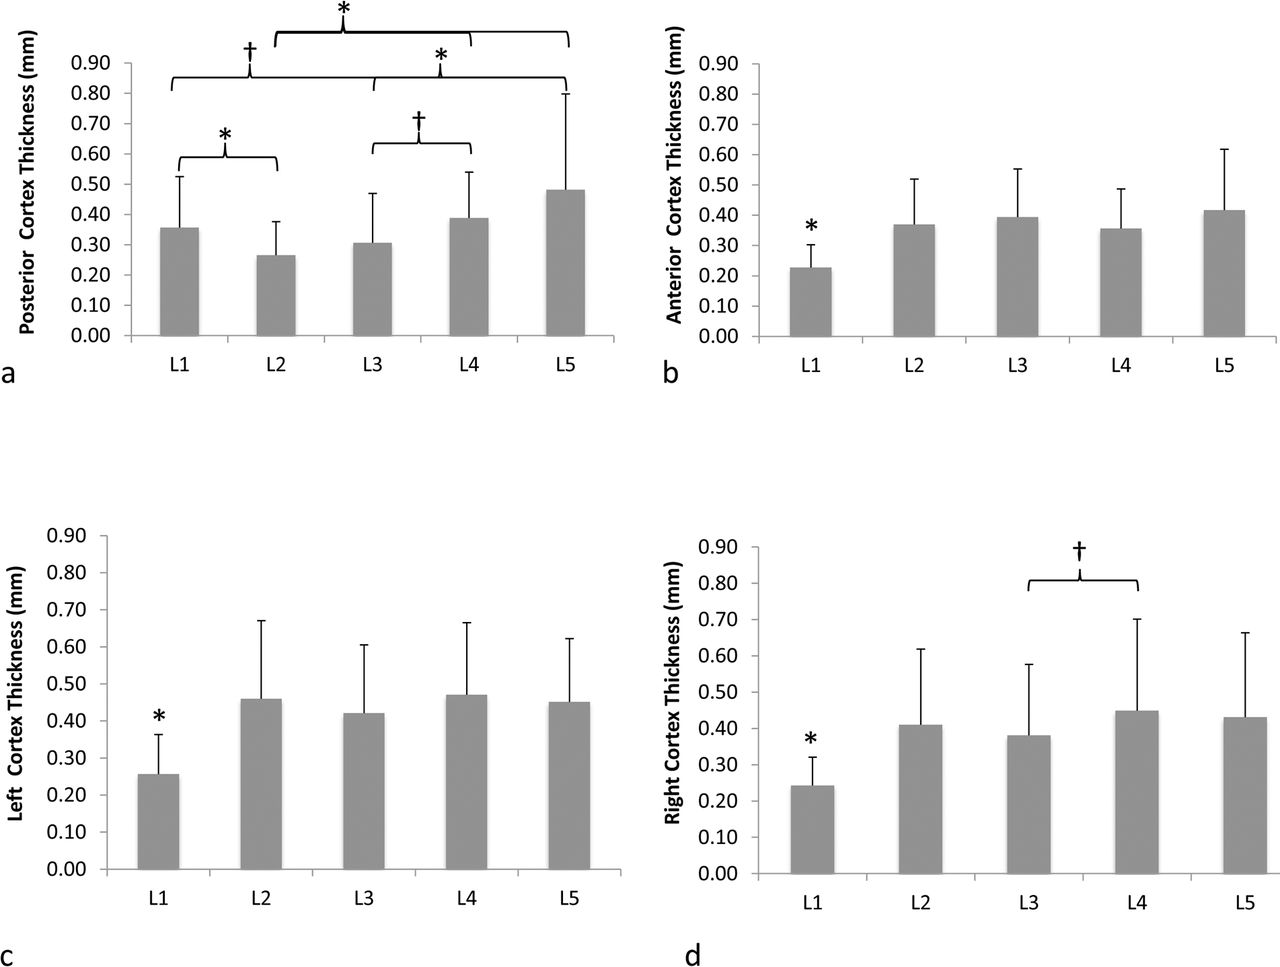
Figure 6 shows the comparisons of vertebral cortex thickness values across vertebral levels for each region (ie, posterior, anterior, left, and right). L2 posterior cortex had the thinnest cortex except for L3 (P ≤ .03). In contrast, L5 posterior cortex was significantly thicker (P ≤ .01) than all other levels, except L1 and L4 (Figure 6a). L1 had significantly thinner (P ≤ .02) anterior, left, and right cortices compared to all other vertebral levels (Figure 6b-d). There were no significant differences (P ≥ .13) between the cortex thickness values for other vertebral levels.

Mean and standard deviations of vertebral cortical thickness for (a) posterior, (b) anterior, (c) left, and (d) right cortex regions for all lumbar vertebrae (*P ≤ .05; †P < .1).
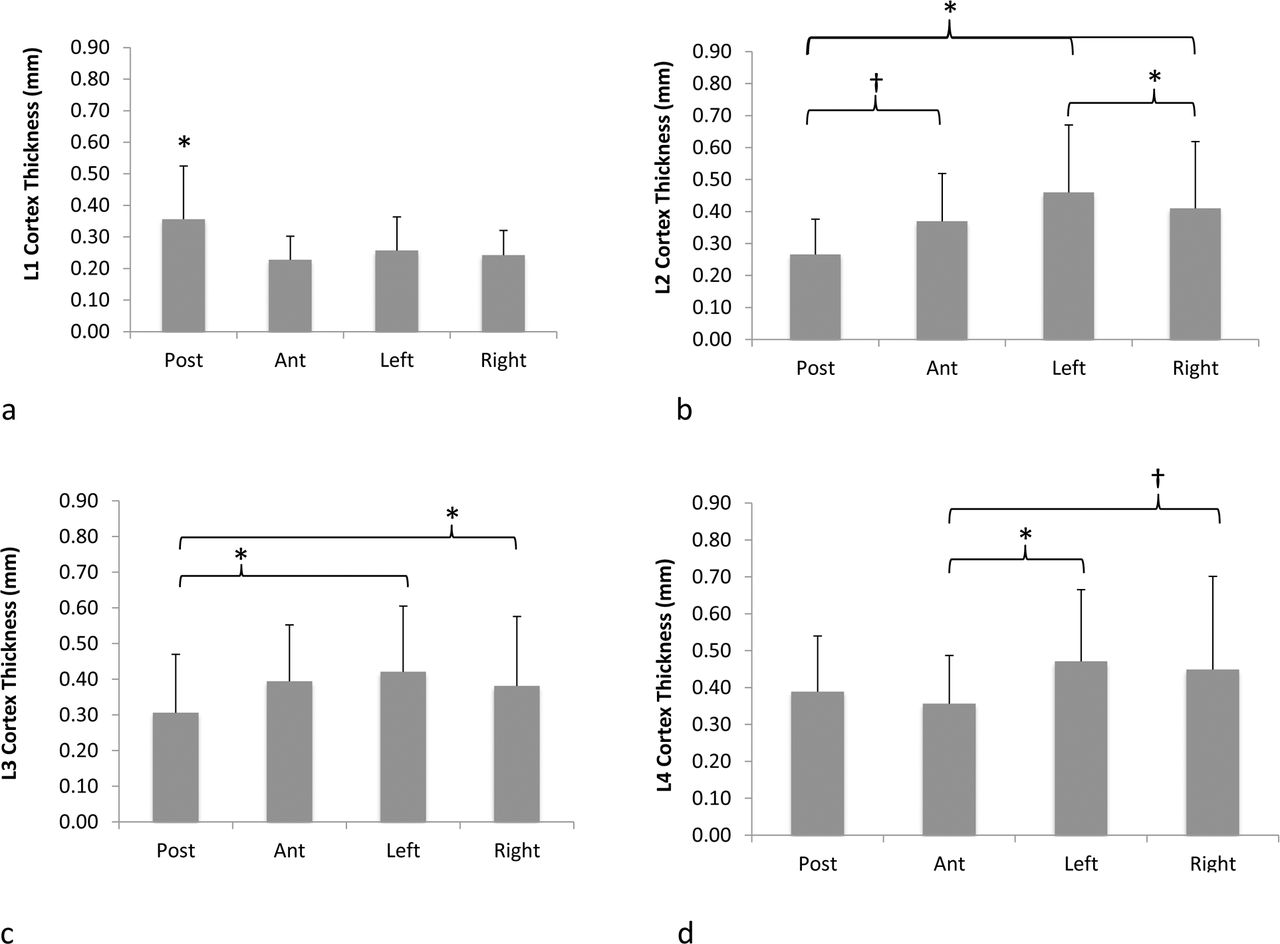
Figure 7 depicts the comparison of cortex thickness values around the circumference of the vertebral body for each lumbar vertebra. For L1 vertebra, the posterior cortex was significantly thicker (P < .01) than all other regions. For L2 vertebrae, posterior cortex was thinner (P = .07) than the anterior cortex and significantly thinner (P ≤ .01) than left and right cortices. Interestingly, the left cortex was significantly thicker (P = .04) than the right cortex for L2 vertebrae. For L3 vertebrae, posterior cortex was significantly (P ≤ .03) thinner than left and right cortices. For L4 vertebrae, anterior cortex was thinner than right (P = .07) and left (P = .01) cortices. There was no difference in thickness between any cortical regions for L5 vertebra.

Mean and standard deviations of vertebral cortical thickness for (a) L1, (b) L2, (c) L3, (d) L4, and (e) L5 vertebrae depicting differences in thickness values between posterior, anterior, left, and right cortex regions of vertebral body (*P ≤ .05; †P < .1).
Interrelationships Between Vertebral Body Structures
Regression analysis between average endplate thickness and maximum ECD revealed moderate positive correlations (R2 = 49%–63%, P ≤ .01) for L4 superior endplates as well as L2 and L5 inferior endplates. Weak positive correlations (R2 = 27%–43%, P ≤ .05) were observed between vertebral cortex thickness and endplate thickness for L2 superior endplate and both L3 endplates. Correlations (R2 < 14%, P > .26) were not significant between endplate thickness and ECD or cortex thickness. There were also no significant correlations (R2 < 23%, P ≥ .07) between trabecular BVF and vertebral cortex thickness or average endplate thickness.
DISCUSSION
Interbody fusion and total disc replacement devices interact with different spinal structures, such as vertebral cortex, endplates, and trabecular bone. The quality of the bone-implant interface is important in the overall performance and safety profile of the device. In fact, a previous publication demonstrated that better bone quality at the bone-implant interface decreases the risk of screw loosening in vertebral bone.14 Therefore, elucidating vertebral bone quality at each lumbar level may aid in optimizing implant designs to improve performance, particularly at the bone-implant interface. This is the first study to comprehensively analyze the morphological characteristics of the vertebral body for each level of lumbar spine. Previous studies analyzed only 1 or 2 of these bone structures in a subset of the lumbar levels.15–17 For example, vertebral endplate morphology was analyzed for L3-L5 vertebrae from physical measurements on human cadavers or images from magnetic resonance imaging.10,18 In contrast, our study developed a novel method incorporating high-resolution micro-CT and image processing techniques and found that inferior endplates are thicker and more concave than their superior counterparts in lower lumbar levels (L3-L5). In fact, the greatest difference occurred in L5 vertebrae, where inferior endplates had the highest concavity (3.0 ± 0.7 mm) and superior endplates had the lowest concavity (1.8 ± 0.4 mm). Our finding of concavity differences between endplates in the same intervertebral disc space (eg, L1-L2, L3-L4, L4-L5) was in good agreement with a previous study.11 In addition, our finding that inferior endplates were thicker compared to superior endplates in lower vertebral levels is in good agreement with previous literature.19 These authors speculate that asymmetry between the 2 endplates exists because the inferior endplate is attached to a larger disc that needs more nutrients and therefore results in a different bone remodeling compared to the superior endplate. We further determined that the peak endplate concavity was mainly (73%) at the center region of the endplate. These findings are important for implants, such as fusion cages or TDRs, that interface with vertebral endplates. Designing implants to match native endplate concavity can increase the implant-endplate contact area, which may aid in reducing complications, such as device migration and subsidence, that have been reported in the literature.20–24 Moreover, the recent technological advances in additive manufacturing (3-dimensional printing) may facilitate the development of such customized implant designs.
Vertebral cortex thickness measurements have been previously reported using mid-sagittal sections of complete lumbar vertebrae. As a result, these studies were able to compare only anterior to posterior cortical regions.8,25 In contrast, the current study analyzed mid-axial slices to compare vertebral cortex thicknesses at different regions (anterior, posterior, left, and right) encompassing the entire vertebral body circumference. We found that vertebral cortex thickness varied circumferentially within a vertebra and that this variation was different for each lumbar vertebral level. For example, L1 vertebrae had significantly greater posterior cortex thickness compared to anterior, left, and right cortices, whereas L5 vertebrae did not have regional cortex variations. Moreover, we found that L1 vertebrae had thinnest anterior, left, and right cortex values compared to all other lumbar vertebral levels. These findings indicate that implants such as anterior spine plates and integrated fixation cages with screws placed both anteriorly and laterally into L1 vertebrae may need additional fixation compared to the same fixation approach at other levels. Weak correlations between the average vertebral cortex thickness and average endplate thickness parameters indicate that these are 2 independent anatomical parameters. We speculate this weak correlation could be due to different bone remodeling mechanisms, as mechanical load bearing will be dissimilar between vertebral endplates and cortices.26,27
Trabecular microstructure for all the lumbar vertebral bodies was also analyzed using high-resolution micro-CT. Although micro-CT has been previously used to evaluate lumbar trabecular microstructure,28,29 there has not been a study to compare trabecular microstructure between different lumbar vertebral levels. Interestingly, we observed that L1 vertebral body had better trabecular bone microstructure than all other lumbar vertebral bodies. However, L1 had the thinnest anterior, left, and right cortices compared to other lumbar vertebrae. We speculate that these differences in L1 anatomy may be due to adaptive bone remodeling processes resulting from disc degeneration, as proposed by Homminga et al.30 The authors reported that degeneration in a disc shifts the mechanical load from the nucleus to the annulus, resulting in bone remodeling to reduce the density of trabecular core and increase the density of vertebral walls. Furthermore, clinical studies have shown that discs at lower lumbar levels (ie, L3-S1) have more degeneration compared to the upper lumbar levels (ie, T12-L1 and L1-L2).31,32 Taken together, we believe that less degeneration at the L1 vertebral level may be the underlying reason for better trabecular microstructure but thinner vertebral wall thicknesses compared to the lower lumbar levels.
Regression analysis indicated that endplate thickness and vertebral cortex thickness are not correlated to trabecular bone microarchitecture for all vertebral levels (R2 < 23%, P ≥ .07). This outcome was somewhat expected, as trabecular and cortical bone have different mechanisms of adaptive bone remodeling that depend on several genetic and environmental factors.33–35 Moreover, adaptive bone remodeling of the vertebra is influenced by the local mechanical loading environment, which can change based on factors such as disc degeneration and discectomy.30,36
There are some limitations that must be considered when interpreting these data. The cadavers used in this study represent elderly population (mean age 70 years) with BMDs in the osteopenic or osteoporotic range. Although many cadaveric studies are limited to elderly donors due to availability, it is important to note that these results may not be applicable to the younger population, which likely has better bone quality. In addition, although the sample size (n = 16) used in the study is in good agreement with previous cadaver publications investigating spine anatomy,37,38 it may not be sufficiently powered to detect differences between groups. To address this issue, we performed a post hoc analysis (type I error of 0.05) to better understand the statistical power of our data set. The results indicated that our study was well powered to detect differences between different lumbar vertebrae for different anatomical measurements (eg, trabecular bone volume fraction: 98% power; endplate concavity depth: 96%; vertebral cortex thickness: 78%). However, endplate thickness had a statistical power of only 57%; therefore, further research is recommended with a larger sample size to more confidently assess endplate thickness differences within the lumbar spine.
CONCLUSIONS
High-resolution micro-CT in combination with image processing techniques was used to comprehensively analyze vertebral body anatomy across all lumbar levels. Our findings indicate that L1 possessed better trabecular microstructure but had the thinnest anterior, left, and right cortices compared to all other lumbar vertebrae. Furthermore, we found that cortex thickness varied circumferentially in L1-L4 vertebral bodies. In the lower lumbar spine (L3-L5), cranial endplates had greater endplate thickness and concavity compared to caudal endplates within an intervertebral disc space. No strong correlations were observed between these anatomical parameters, suggesting that bone morphology in the vertebral body is mostly independent of each other. These data within and across lumbar vertebrae aid in improved understanding of the bone-implant interface and may be valuable during implant design. In addition, quantitative information of these anatomical parameters may help clinicians with optimal implant design selection as well as surgical placement of these devices into their respective locations.
ACKNOWLEDGMENTS
This work was supported by the FDA Office of Women's Health and in part by a postdoctoral appointment to the ORISE Research Participation Program at CDRH. The authors would like to thank Amanda Shannon and Michael Molyneaux-Francis for micro-CT and MIMICS evaluations.
Footnotes
Disclosures and COI: The authors report no conflict of interest concerning the materials or methods used in this study or the findings specified in this article.
- ©International Society for the Advancement of Spine Surgery
- This manuscript is generously published free of charge by ISASS, the International Society for the Advancement of Spine Surgery. Copyright © 2019 ISASS.
REFERENCES
In this issue


Jump to section
Related Articles
Cited By...
- No citing articles found.