


Article Figures & Data
Figures
- Figure 1
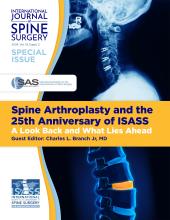
Postoperative complications. In the whole cohort, the staged (ST) group had more complications compared with the same-day (SD) group in the univariate analysis (OR 2.97, P = 0.001) and significantly higher incidence of postoperative pulmonary embolism (PE), altered mental status or delirium, cardiac arrhythmia, and surgical site infections. There were 63 patients (63%) with a postoperative complication within the long segment cohort with no difference between ST and SD groups on unadjusted analysis. Abbreviations: AMS, altered mental status; DVT, deep venous thrombosis; IPW, inverse probability weighting; LE, lower extremity; LS, long segment; PE, pulmonary embolism; SNF, skilled nursing facility; TIA, transient ischemic attack.
- Figure 2
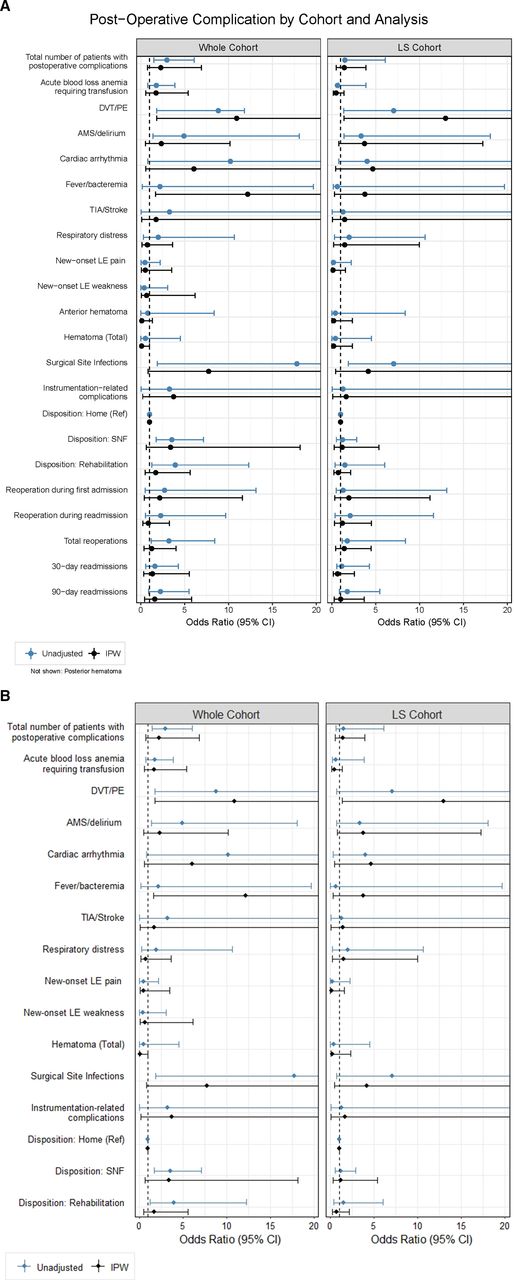
Postoperative PE. Using IPW, the rate of PE was significantly higher in staged (ST) vs same-day (SD) groups in the whole cohort (12% vs 1.2%, P = 0.045). In the long segment cohort, there was a significant difference in the rate of postoperative PE in the ST vs SD group (OR = 13.0, P = 0.24). Abbreviations: DVT, deep venous thrombosis; IPW, inverse probability weighting; LS, long segment; PE, pulmonary embolism.
- Figure 3
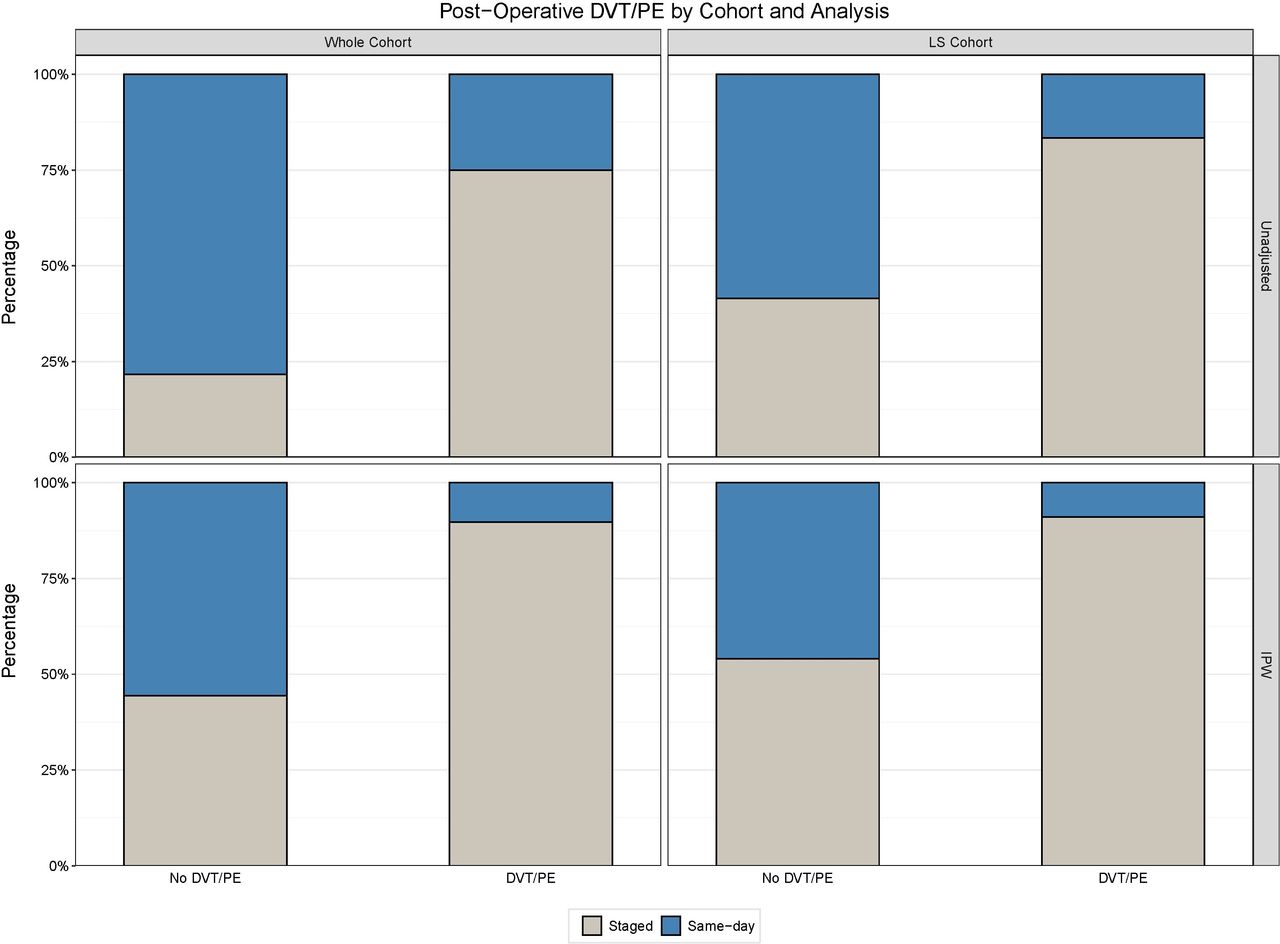
Length of Stay: In both unadjusted and IPW analyses, the length of stay for the staged (ST) group was longer than the same-day (SD) group (10.8 vs 64.8 days), and the ST group was expected to have length of stay 2.2 times longer than the SD group (P < 0.0001) in the whole cohort. In the long segment cohort, on both unadjusted and IPW analyses, we observed a longer length of stay for the ST group than the SD group (10.5 vs 6.2 days), and the ST group was expected to have length of stay 1.7 times longer than the SD group (P < 0.0001). Abbreviations: IPW, inverse probability weighting; LS, long segment.
- Figure 4
Hospital costs. Within the whole cohort, the mean cost for same-day (SD) patients was $71,193 compared with $145,907 for staged (ST) patients. For the unadjusted analysis, the average cost was 1.9 times greater in the ST group vs SD group (95% CI 1.6008, 2.2698, P < 0.0001). On IPW, the average cost was 1.6 times greater in the ST group (95% CI 1.0733, 2.2887, P = 0.0203). The mean cost for SD patients with more than 4 levels fused was $93,267.67 compared with $153,481.20 for staged patients. The average cost for the ST group was 1.5 times greater than in the SD group (95% CI 1.2169, 1.8182, P = 0.0002). This significance was again seen using IPW with the average cost being 1.5 times greater in the ST group (95% CI 1.1730, 1.8728, P = 0.0013). Abbreviations: IPW, inverse probability weighting; LS, long segment.


Tables
Characteristic ST (n = 50) Same-Day (n = 161) Unadjusted IPW OR (95% CI) P OR (95% CI) P Diff (95% CI) Diff (95% CI) Age, y Range (median) 29–76 (58) 19–83 (57) 2.71 (−0.57, 5.98) 0.105 3.08 (−2.27, 8.44) 0.257 Mean (SD) 58.7 (8.9) 56.0 (13.7) Female sex, n (%) 30 (60.0%) 106 (65.8%) 0.78 (0.39, 1.59) 0.500 1.13 (0.40, 3.24) 0.814 Race, n (%) White 46 (92.0%) 121 (75.2%) Reference 0.008* Reference 0.792 Black 1 (2.0%) 28 (17.4%) 0.09 (0.01, 0.71) 0.60 (0.08, 4.85) Other 3 (6.0%) 12 (7.5%) 0.66 (0.18, 2.44) 1.56 (0.23, 10.75) BMI, kg/m2 Range (median) 20.6–42.0 (28.8) 18.8–46.0 (28.5) 0.57 (−1.13, 2.27) 0.505 1.96 (−0.07, 3.99) 0.089 Mean (SD) 29.2 (5.2) 28.7 (5.4) Smoker 6 (12.0%) 28 (17.4%) 0.65 (0.21, 1.74) 0.509 1.53 (0.33, 7.14) 0.587 Substance user 2 (4.0%) 9 (5.6%) 0.70 (0.07, 3.55) >0.99 0.53 (0.10, 2.91) 0.468 Comorbidities Diabetes mellitus 6 (12.0%) 24 (14.9%) 0.78 (0.24, 2.13) 0.817 1.46 (0.33, 6.52) 0.622 COPD 7 (14.0%) 8 (5.0%) 3.11 (0.90, 10.39) 0.052 8.60 (1.83, 40.30) 0.006* History of prior deep venous thrombosis/pulmonary embolism 2 (4.0%) 12 (7.5%) 0.52 (0.05, 2.46) 0.527 0.69 (0.10, 4.69) 0.701 Hyperlipidemia 15 (30.0%) 57 (35.4%) 0.78 (0.36, 1.62) 0.609 1.67 (0.54, 5.15) 0.373 Hypertension 32 (64.0%) 85 (52.8%) 1.59 (0.79, 3.26) 0.194 1.03 (0.35, 3.04) 0.952 Other cardiac diagnoses 12 (24.0%) 33 (20.5%) 1.22 (0.52, 2.73) 0.693 1.22 (0.30, 4.90) 0.782 Anemia 1 (2.0%) 9 (5.6%) 0.34 (0.01, 2.61) 0.458 0.31 (0.04, 2.64) 0.283 Coagulation disorders 2 (4.0%) 6 (3.7%) 1.08 (0.10, 6.27) >0.99 0.56 (0.10, 3.26) 0.519 Thyroid disorders 10 (20.0%) 33 (20.5%) 0.97 (0.39, 2.24) >0.99 0.54 (0.20, 1.43) 0.213 Postmenopausal osteoporosis 3 (6.0%) 13 (8.1%) 0.69 (0.12, 2.67) 0.765 2.22 (0.32, 15.61) 0.422 Preoperative ASA score 1 1 (2.0%) 1 (0.6%) Reference 0.446 Reference 0.945 2 32 (64.0%) 111 (68.9%) 0.29 (0.02, 4.74) 0.93 (0.05, 16.17) 3 17 (34.0%) 49 (30.4%) 0.35 (0.02, 5.86) 0.78 (0.04, 14.12) Abbreviations: ASA, American Society of Anesthesiologists; BMI, body mass index; COPD, chronic obstructive pulmonary disease; IPW, inverse probability weighting; ST, staged.
Note: There was no significant difference in age and sex distribution, mean BMI, ASA classification, preoperative comorbidities, or smoking status between the groups. The racial distribution was significantly different, with more White patients in the ST group. However, after IPW, there was no significant difference in race. In the IPW model, patient’s undergoing ST procedures had a significantly higher rate of COPD (OR = 8.6, P = 0.0063).
*Signifies P < 0.05.
Characteristic ST (n = 44) SD (n = 56) Unadjusted IPW OR (95% CI) P OR (95% CI) P Diff (95% CI) Diff (95% CI) Age, y Range (median) 29–76 (59) 23–81 (63.5) 3.20 (−7.36, 0.96) 0.130 2.87 (−7.47, 1.73) 0.219 Mean (SD) 58.8 (9.0) 62.0 (11.9) Female sex, n (%) 28 (63.6) 44 (78.6) 0.48 (0.18, 1.27) 0.119 0.57 (0.18, 1.77) 0.330 Race, n (%) White 40 (90.9%) 44 (78.6%) Reference 0.073 Reference 0.052 Black 1 (2.3%) 9 (16.1%) 0.12 (0.01, 1.01) 0.06 (0.01, 0.59) Other 3 (6.8%) 3 (5.4%) 1.10 (0.21, 5.77) 0.98 (0.12, 7.95) BMI, kg/m2 Range (median) 20.6–41.9 (28.8) 18.8–42.1 (27.9) 1.33 (−0.78, 3.45) 0.214 0.13 (−2.01, 2.27) 0.907 Mean (SD) 29.2 (5.2) 27.8 (5.3) Smoker, n (%) 4 (9.1%) 5 (8.9%) 1.02 (0.19, 5.08) >0.99 1.11 (0.26, 4.78) 0.885 Substance user, n (%) 2 (4.6%) 3 (5.4%) 0.84 (0.07, 7.71) >0.99 1.06 (0.16, 7.03) 0.954 Comorbidities Diabetes mellitus 5 (11.4%) 7 (12.5%) 0.90 (0.21, 3.58) >0.99 1.97 (0.48, 8.03) 0.344 Chronic obstructive pulmonary disease 5 (11.4%) 3 (5.4%) 2.27 (0.41, 15.33) 0.295 2.71 (0.58, 12.66) 0.204 History of prior deep venous thrombosis/pulmonary embolism 1 (2.3%) 6 (10.7%) 0.19 (0.00, 1.72) 0.131 0.34 (0.04, 3.06) 0.338 Hyperlipidemia 14 (31.8%) 27 (48.2%) 0.50 (0.20, 1.23) 0.107 0.92 (0.34, 2.49) 0.869 Hypertension 29 (65.9%) 33 (58.9%) 1.35 (0.55, 3.34) 0.537 0.91 (0.33, 2.52) 0.862 Other cardiac diagnoses 11 (25.0%) 16 (28.6%) 0.83 (0.30, 2.22) 0.821 1.04 (0.35, 3.04) 0.948 Anemia 1 (2.3%) 3 (5.4%) 0.41 (0.01, 5.37) 0.629 0.67 (0.06, 7.26) 0.741 Coagulation disorders 2 (4.6%) 2 (3.6%) 1.29 (0.09, 18.37) >0.99 3.57 (0.39, 33.06) 0.262 Thyroid disorders 10 (22.7%) 12 (21.4%) 1.08 (0.37, 3.10) >0.99 1.69 (0.59, 4.81) 0.330 Postmenopausal osteoporosis 2 (4.9%) 5 (9.8%) 0.47 (0.04, 3.10) 0.455 0.46 (0.08, 2.78) 0.398 Preoperative ASA score 2 29 (65.9%) 34 (60.7%) Reference 0.678 Reference 0.914 3 15 (34.1%) 22 (39.3%) 0.80 (0.32, 1.96) 0.95 (0.37, 2.46) Abbreviations: ASA, American Society of Anesthesiologists; BMI, body mass index; IPW, inverse probability weighting; SD, same-day; ST, staged.
Note: Within the subgroup of 100 patients who underwent >4 levels of fusion (ST = 44, SD = 56), the ST and SD groups were not significantly different in demographics or preoperative comorbidities.
Characteristics ST SD Unadjusted IPW OR (95% CI) P OR (95% CI) P Ratio (95% CI) Ratio (95% CI) Whole Cohort n 50 161 Duration between procedures when staged, da Range (median) 1–20 (2) - Mean (SD) 2.9 (2.8) - Number of levels fused in ALIF, n (%) 1 13 (26.0%) 84 (52.2%) Reference <0.001* Reference 0.603 2 22 (44.0%) 68 (42.2%) 2.09 (0.98, 4.45) 1.42 (0.43, 4.69) 3 14 (28.0%) 8 (5.0%) 11.3 (3.97, 32.20) 1.99 (0.52, 7.63) 4 1 (2.0%) 1 (0.6%) 6.46 (0.38, 109.70) 0.37 (0.02, 6.72) Number of levels fused in PSF Range (median) 1–16 (8) 1–15 (2) 2.79 (2.20, 3.54) <0.001* 1.29 (0.81, 2.05) 0.275 Mean (SD) 9.1 (4.5) 3.8 (3.2) Combined EBL, mL Range (median) 25–4000 (1200) 25–5100 (350) 2.28 (1.61, 3.22) <0.001* 1.07 (0.62, 1.83) 0.819 Mean (SD) 1220 (891.5) 609.2 (710.5) Total intraoperative complications, n (%) 7 (14.0%) 4 (2.5%) 6.39 (1.52, 30.83) 0.004* 2.94 (0.55, 15.74) 0.207 LS Cohort n 44 56 Duration between procedures when staged, da Range (median) 0–22 (2) - Mean (SD) 2.9 (2.9) - Number of levels fused in ALIF, n (%) 1 11 (25.0%) 34 (60.7%) Reference <0.001* Reference 0.322 2 18 (40.9%) 17 (30.4%) 3.27 (1.27, 8.46) 1.05 (0.34, 3.20) 3 14 (31.8%) 4 (7.1%) 10.82 (2.94, 39.80) 2.49 (0.59, 10.44) 4 1 (2.3%) 1 (1.8%) 3.09 (0.18, 53.65) 0.17 (0.01, 3.14) Number of levels fused in PSF Range (median) 4–16 (8) 4–15 (8) 1.37 (1.17, 1.62) 0.002* 1.09 (0.86, 1.39) 0.457 Mean (SD) 10 (3.9) 7.3 (3.1) Combined EBL, m Range (median) 25–4000 (1300) 25–5100 (875) 1.31 (0.89, 1.92) 0.088 0.82 (0.48, 1.40) 0.471 Mean (SD) 1351.7 (869) 1127.6 (945.4) Total intraoperative complications, n (%) 6 (13.6%) 2 (3.6%) 4.26 (0.70, 44.80) 0.133 4.25 (0.73, 24.92) 0.109 Abbreviations: ALIF, anterior lumbar interbody fusion; EBL, estimated blood loss; IPW, inverse probability weighting; LS, long segment; PSF, posterior spinal fusion; SD, same day; ST, staged.
Note: Intraoperative complications in the whole cohort were recorded in 11 cases (5.2%), with the ST group showed a significantly higher incidence compared with the SD group (OR = 6.4, P = 0.004). In the LS cohort, intraoperative complications were recorded in 8 patients (8%) with no statistically significant difference between ST and SD groups (Table 2).
*Signifies P < 0.05.
↵a The median duration between the staged procedures was 2.9 days with a range of 0 to 22 days for the LS and whole cohort.
Complications ST SD Unadjusted IPW OR (95% CI) P OR (95% CI) P Ratio (95% CI) Ratio (95% CI) Whole Cohort n 50 161 No. of patients with postoperative complications 31 (62.0%) 57 (35.4%) 2.98 (1.47, 6.09) 0.001* 2.28 (0.75, 6.91) 0.146 Acute blood loss anemia requiring transfusion 14 (28.0%) 29 (18%) 1.77 (0.78, 3.89) 0.159 1.74 (0.56, 5.41) 0.338 DVT/PE 6 (12.0%) 2 (1.2%) 10.84 (1.83, 111.79) 0.003* 10.92 (1.80, 66.15) 0.045* AMS/delirium 8 (16.0%) 6 (3.7%) 4.92 (1.4, 18.05) 0.006* 2.34 (0.54, 10.17) 0.257 Cardiac arrhythmia 3 (6.0%) 1 (0.6%) 10.21 (0.79, 539.36) 0.042* 6.05 (0.58, 63.72) 0.134 Fever/bacteremia 2 (4.0%) 3 (1.9%) 2.19 (0.18, 19.66) 0.339 12.18 (1.67, 88.74) 0.014* transient ischemic attack/stroke 1 (2.0%) 1 (0.6%) 3.27 (0.04, 257.88) 0.419 1.74 (0.10, 29.51) 0.701 Respiratory distress 3 (6.0%) 5 (3.1%) 1.99 (0.30, 10.64) 0.397 0.74 (0.15, 3.63) 0.711 New-onset LE pain 2 (4.0%) 13 (8.1%) 0.47 (0.05, 2.22) 0.529 0.52 (0.08, 3.51) 0.503 New-onset LE weakness 1 (2.0%) 8 (5.0%) 0.39 (0.01, 3.05) 0.689 0.67 (0.07, 6.17) 0.724 Hematoma 1 (2.0%) 6 (3.7%) 0.53 (0.01, 4.52) >0.99 0.10 (0.01, 0.99) 0.049* Surgical site infections 5 (10.0%) 1 (0.6%) 17.78 (1.89, 845.85) 0.003* 7.73 (0.83, 72.17) 0.073 Instrumentation-related complications 1 (2.0%) 1 (0.6%) 3.27 (0.04, 257.88) 0.419 3.74 (0.22, 63.44) 0.361 LS Cohort n 44 56 No. of patients with postoperative complications 30 (68.2%) 33 (58.9%) 1.49 (1.47, 6.09) 0.406 1.42 (0.52, 3.89) 0.495 Acute blood loss anemia requiring transfusion 13 (29.6%) 22 (39.3%) 0.65 (0.78, 3.89) 0.399 0.50 (0.18, 1.39) 0.181 DVT/PE 5 (11.4%) 1 (1.8%) 7.05 (1.37, 94.4) 0.084 12.96 (1.39, 121.12) 0.025* AMS/delirium 7 (15.9%) 3 (5.4%) 3.34 (1.40, 18.05) 0.101 3.73 (0.81, 17.19) 0.091 Cardiac arrhythmia 3 (6.8%) 1 (1.8%) 4.02 (0.79, 539.36) 0.317 4.68 (0.44, 49.63) 0.201 Fever/bacteremia 1 (2.3%) 2 (3.6%) 0.63 (0.18, 19.65) >0.99 3.77 (0.32, 44.48) 0.291 TIA/Stroke 1 (2.3%) 1 (1.8%) 1.28 (0.04, 257.88) >0.99 1.47 (0.09, 24.87) 0.791 Respiratory distress 3 (6.8%) 2 (3.6%) 1.98 (0.30, 10.64) 0.652 1.47 (0.22, 9.98) 0.693 New-onset LE pain 1 (2.3%) 6 (10.7%) 0.19 (0.05, 2.22) 0.131 0.14 (0.01, 1.57) 0.112 New-onset LE weakness 0 (0.0%) 5 (8.9%) 0.00 (0.00, 3.05) 0.065 - - Hematoma 1(2.3%) 3 (5.4%) 0.41 (0.01, 4.52) 0.084 0.22 (0.02, 2.36) 0.210 Surgical site infections 5 (11.4%) 1 (1.8%) 7.05 (1.89, 845.85) >0.99 4.16 (0.45, 38.50) 0.210 Instrumentation-related complications 1 (2.3%) 1 (1.8%) 1.28 (0.04, 257.88) 0.629 1.64 (0.10, 27.86) 0.731 Abbreviations: AMS, altered mental status; DVT, deep venous thrombosis; IPW, inverse probability weighting; LE, lower extremity; LS, long segment; PE, pulmonary embolism; SD, same day; ST, staged; TIA, transient ischemic attack.
Note: The total number of patients with postoperative complications was 88 (41.7%), with significantly more in the SD group in the univariate analysis (OR 2.97, P = 0.001). There were 63 (63%) patients with postoperative complications within the LS cohort with no difference between the ST and SD groups on unadjusted analysis. IPW showed a significant difference in the rate of postoperative PE in the ST vs SD group (OR = 13.0, P = 0.24).
*Signifies P < 0.05.
Outcome Measure ST Same-Day Unadjusted IPW OR (95% CI) P OR (95% CI) Ratio (95% CI) Ratio (95% CI) Whole Cohort LOS (d) Range (median) 4–44 (8.5) 12.5–22 (4) 2.17 (1.87, 2.52) <0.001* 1.86 (1.43, 2.42) <0.001* Mean (SD) 10.8 (6.8) 4.8 (2.5) Disposition Home 19 (38.0%) 112 (69.6%) Reference <0.001* Reference 0.329 SNF 6 (12.0%) 9 (5.6%) 3.54 (1.75, 7.14) 3.39 (0.63, 18.16) Rehabilitation 24 (48.0%) 40 (24.8%) 3.93 (1.26, 12.31) 1.70 (0.51, 5.62) Death 1 (2.0%) 0 (0.0%) - - Reoperation during first admission 4 (8.0%) 5 (3.1%) 2.71 (0.51, 13.11) 0.221 2.16 (0.40, 11.58) 0.367 Reoperation during readmission 7 (14.0%) 8 (5.0%) 2.27 (0.54, 9.66) 0.072 0.86 (0.23, 3.26) 0.823 Total reoperations 11 (22.0%) 13 (8.1%) 3.21 (1.19, 8.41) 0.011* 1.24 (0.38, 4.03) 0.724 30-day readmissions 8 (16.0%) 17 (10.6%) 1.61 (0.56, 4.28) 0.320 1.33 (0.32, 5.52) 0.691 90-day readmissions 11 (22.0%) 18 (11.2%) 2.24 (0.88, 5.48) 0.062 1.59 (0.43, 5.80) 0.484 LS Cohort LOS, d Range (median) 4–25 (9) 1–22 (5.5) 1.70 (1.42, 2.04) <0.001* 1.59 (1.29, 1.95) < 0.001* Mean (SD) 10.5 (5) 6.2 (3.1) Disposition Home 16 (36.4%) 24 (42.9%) Reference 0.837 Reference 0.761 SNF 5 (11.4%) 5 (8.9%) 1.22 (0.52, 2.85) 1.19 (0.26, 5.38) Rehabilitation 22 (50.0%) 27 (48.2%) 1.50 (0.37, 6.03) 0.74 (0.26, 2.15) Death 1 (2.3%) 0 (0.0%) - - Reoperation during first admission 3 (6.8%) 3 (5.4%) 1.29 (0.51, 13.11) >0.99 1.95 (0.34, 11.20) 0.455 Reoperation during readmission 7 (15.9%) 5 (8.9%) 2.10 (0.38, 11.59) >0.99 1.21 (0.32, 4.52) 0.781 Total reoperations 10 (22.7%) 8 (14.3%) 1.76 (1.19, 8.41) 0.304 1.42 (0.45, 4.49) 0.549 30-day readmissions 7 (15.9%) 8 (14.3%) 1.14 (0.56, 4.28) >0.99 0.65 (0.17, 2.59) 0.545 90-day readmissions 10 (22.7%) 8 (14.3%) 1.76 (0.88, 5.48) 0.304 1.02 (0.28, 3.70) 0.978 Abbreviations: IPW, inverse probability weighting; LOS, length of stay; LS, long segment; SNF, skilled nursing facility; ST, staged.
Note: Length of stay was significantly different between the ST and same-day groups for both the whole cohort and the LS cohort (P < 0.001). Total 30-day readmission rate was not different between groups. Reoperations were significantly higher in ST group (P = 0.011), though this difference was not seen using IPW or in the LS cohort.
*Signifies P < 0.05
In this issue


