


Article Figures & Data
Figures
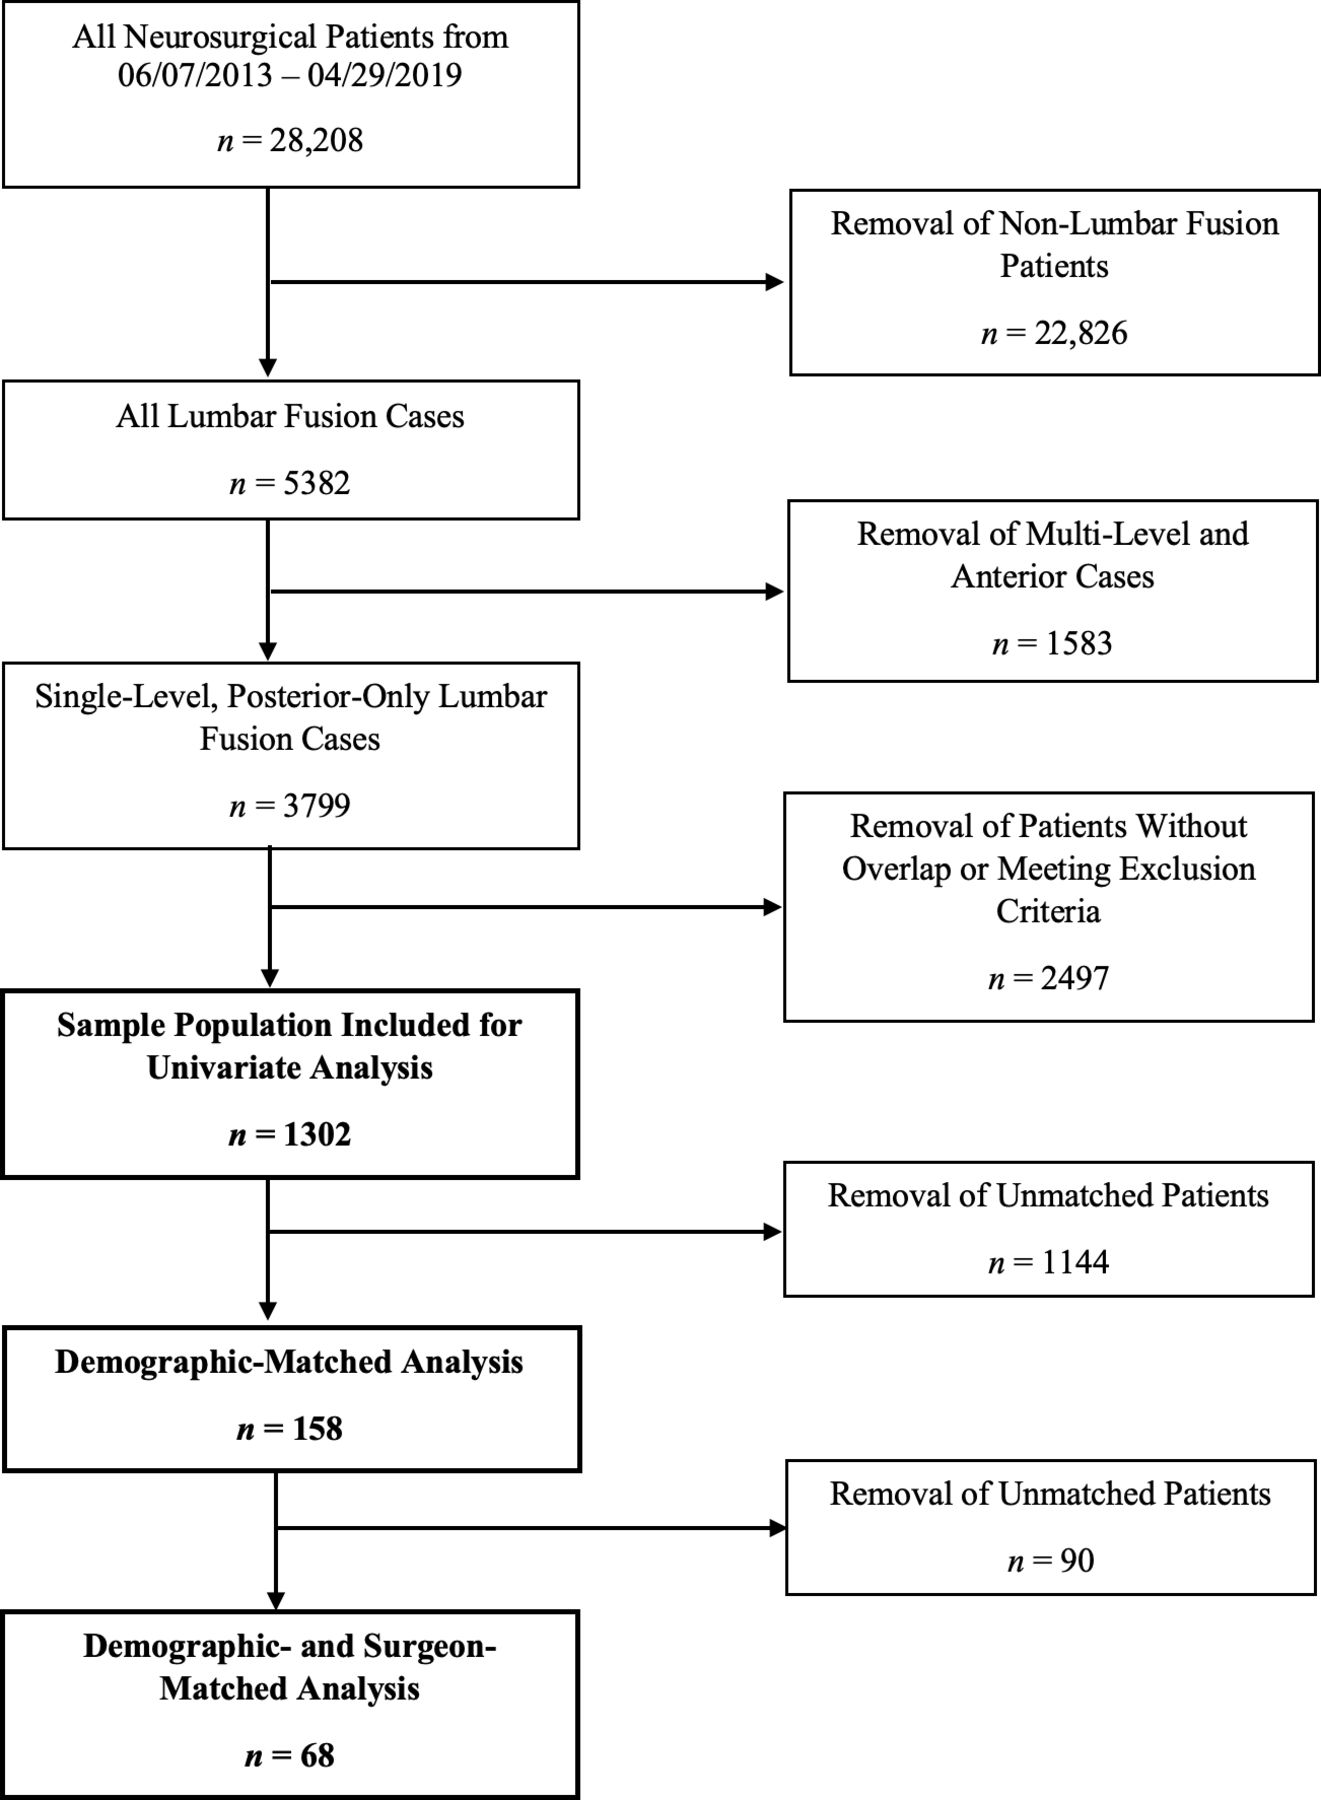
- Figure 1
Flowchart of lumbar fusion cases included within the present study.
- Figure 2
Comparison of baseline health characteristics, distribution of comorbidities, and operative time among patients with the most and least amount of surgical overlap. *Significance at P value <0.05. ASA, American Society of Anesthesiologists grade; CCI, Charlson Comorbidity Index score; CHF, congestive heart failure; CKD, chronic kidney disease; COPD, chronic obstructive pulmonary disease; CVA, cerebrovascular accident; DM, diabetes mellitus; HIV, human immunodeficiency virus; LD, liver disease; MI, myocardial infarction; PUD, peptic ulcer disease; PVD, peripheral vascular disease; RA, rheumatoid arthritis.
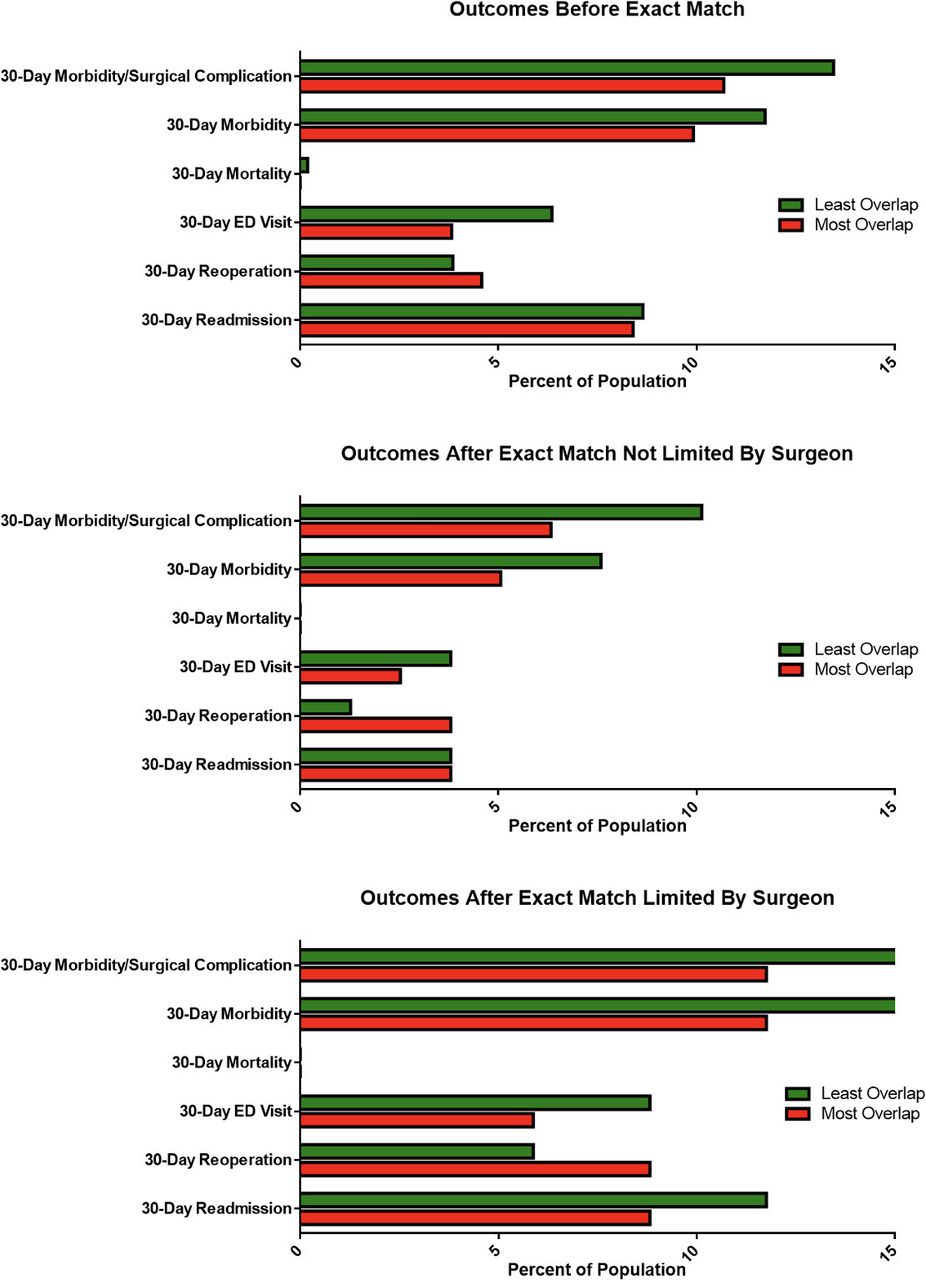
- Figure 3
Distribution of short-term outcomes following single-level, posterior lumbar fusion. No differences were observed in any morbidity or mortality outcomes between exact matched cohorts. ED, emergency department.


Tables
- Table 1
Characteristics of patients whose surgeries had the least amount of overlap (bottom 40% of patients with overlapping surgeries) and the most amount of overlap (top 10% of patients with overlapping surgeries).
Variable Least Overlap (N = 520) Most Overlap (N = 131) P Value Age (y), mean (range) 60.30 (24–88) 63.90 (26–87) 0.001 Gender, n (%) 0.96 Male 225 (43.3%) 57 (43.5%) Female 295 (56.7%) 74 (56.5%) Race, n (%) Asian 6 (1.2%) 1 (0.8%) 0.55 Black 55 (10.6%) 12 (9.2%) White 441 (84.8%) 117 (89.3%) Hispanic 4 (0.8%) 0 (0%) Unknown 10 (1.9%) 0 (0%) Other 2 (0.4%) 1 (0.8%) East Indian 2 (0.4%) 0 (0%) Insurance, n (%) 0.017
Commercial 20 (3.8%) 2 (1.5%) Medicare 213 (41.0%) 73 (55.7%) Medicaid 26 (5.0%) 4 (3.1%) Managed care 192 (36.9%) 33 (25.2%) Blue cross 69 (13.3%) 19 (14.5%) Tobacco use within past 12 mo, n (%) 0.08 Yes 81 (15.6%) 11 (8.4%) No 437 (84.0%) 120 (91.6%) Unknown 2 (0.4%) 0 (0%) Fasting blood glucose (mg/dL), mean (range) 133.95 (60–303) 127.84 (79–209) 0.32 Surgeries before index operation (count), mean (range) Ever 0.58 (0–12) 0.61 (0–14) 0.39 90 d Prior 0.07 (0–5) 0.02 (0–1) 0.13 Direct cost of operative supplies and implants ($), mean (range) 10,254 (116–50,894) 6696 (342–27,592) <0.001 Length of hospital stay (h), mean (range) 104.64 (24–1070) 96.59 (26–563) 0.006 Length of follow-up (mo), mean (range) 43.62 (0.5–83.11) 38.24 (0.7–80.74) 0.018 Non-neurosurgical operations 30 d after index operation (count), mean (range) 0.07 (0–3) 0.09 (0–2) 0.31 Note: Statistically significant (P < 0.05) values are bolded.
- Table 2
Characteristics of the subset of patients with the least amount of overlap (bottom 40% of patients with overlap) and the most amount of overlap (top 10% of patients with overlap), subsequently matched on demographic variables but not the operating surgeon.
Variable Least Overlap (N = 79) Most Overlap (N = 79) P Value Age (y), mean (range) 61.96 (24–79) 63.20 (26–79) 0.50 Gender, n (%) >0.99 Male 32 (40.5%) 32 (40.5%) Female 47 (59.5%) 47 (59.5%) Race, n (%) >0.99 Black 2 (2.5%) 2 (2.5%) White 77 (97.5%) 77 (97.5%) Insurance, n (%) 0.53 Commercial 3 (3.8%) 1 (1.3%) Medicare 39 (49.4%) 42 (53.2%) Medicaid 4 (5.1%) 1 (1.3%) Managed care 22 (27.8%) 21 (26.6%) Blue cross 11 (13.9%) 14 (17.7%) Tobacco use within past 12 mo, n (%) >0.99 Yes 1 (1.3%) 1 (1.3%) No 78 (98.7%) 78 (98.7%) Fasting blood glucose (mg/dL), mean (range) 136.26 (92–222) 128.48 (79–207) 0.35 Surgeries before index operation (count), mean (range) Ever 0.19 (0–4) 0.14 (0–4) 0.98 90 d Prior 0.03 (0–2) 0.01 (0–1) >0.99 Direct cost of operative supplies and implants ($), mean (range) 10,606 (960–42,850) 6029 (342–20,689) <0.001 Length of hospital stay (h), mean (range) 106.43 (48–400) 84.92 (26–367) 0.001 Length of follow-up (mo), mean (range) 43.36 (3.75–81.27) 40.16 (0.66–80.75) 0.41 Non-neurosurgical operations 30 d after index operation (count), mean (range) 0.04 (0–1) 0.08 (0–1) 0.31 Note: Statistically significant (P < 0.05) values are bolded.
- Table 3
Characteristics of the subset of patients with the least amount of overlap (bottom 40% of patients with overlap) and the most amount of overlap (top 10% of patients with overlap), subsequently matched on both demographic variables and limited to the same operating surgeon.
Variable Least Overlap (N = 34) Most Overlap (N = 34) P Value Age (y), mean (range) 56.74 (24–76) 58.26 (26–76) 0.64 Gender, n (%) >0.99 Male 19 (55.9%) 19 (55.9%) Female 15 (44.1%) 15 (44.1%) Race, n (%) >0.99 Black 1 (2.9%) 1 (2.9%) White 33 (97.1%) 33 (97.1%) Insurance, n (%) 0.20 Commercial 4 (11.8%) 0 (0%) Medicare 12 (35.3%) 13 (38.2%) Medicaid 2 (5.9%) 1 (2.9%) Managed care 11 (32.4%) 10 (29.4%) Blue cross 5 (14.7%) 10 (29.4%) Tobacco use within past 12 mo, n (%) >0.99 Yes 1 (2.9%) 1 (2.9%) No 33 (97.1%) 33 (97.1%) Fasting blood glucose (mg/dL), mean (range) 122.48 (92–174) 128.73 (79–207) 0.46 Surgeries before index operation (count), mean (range) Ever 0.44 (0–10) 0.24 (0–4) 0.98 90 d Prior 0.06 (0–2) 0.03 (0–1) >0.99 Direct cost of operative supplies and implants ($), mean (range) 7120 (116–26,035) 6400 (342–17,459) 0.75 Length of hospital stay (h), mean (range) 86.73 (25–242) 69.65 (31–151) 0.10 Length of follow-up (mo), mean (range) 34.84 (3.0–78.44) 41.42 (1.3–77.69) 0.21 Non-neurosurgical operations 30 d after index operation (count), mean (range) 0.12 (0–1) 0.09 (0–1) 0.70 - Table 4
Short-term outcome data analyzing the impact of increasing duration of overlap as a continuous variable. Exact-matched patients with the most amount of overlap (top 10%) and least amount of overlap (bottom 40%) were also compared.
30-d Outcomes Increasing Duration of Overlap After Exact Match Not Limited by Surgeon After Exact Match Limited by Surgeon Readmission P = 0.91
1.00 (0.99–1.01)P > 0.99
1.00 (0.17–5.82)P = 0.69
0.67 (0.08–4.48)Reoperation P = 0.91
1.00 (0.99–1.01)P = 0.38
3.00 (0.32–78.99)P = 0.69
1.50 (0.22–12.61)Emergency department visits P = 0.41
1.00 (0.99–1.01P = 0.63
0.50 (0.02–6.57)P = 0.69
0.67 (0.08–4.48)Mortality P = 0.90
1.00 (0.94–1.05)N/A N/A Morbidity P = 0.70
1.00 (0.99–1.01)P = 0.51
0.60 (0.12–2.60)P = 0.51
0.60 (0.12–2.60)Morbidity/surgical complication P = 0.78
1.00 (0.99–1.01)P = 0.39
0.57 (0.15–1.97)P = 0.34
0.50 (0.10–2.01)Note: Data are presented as OR (95% CI).
In this issue


Jump to section
Related Articles
Cited By...
- No citing articles found.