


Article Figures & Data
Figures
- Fig. 1
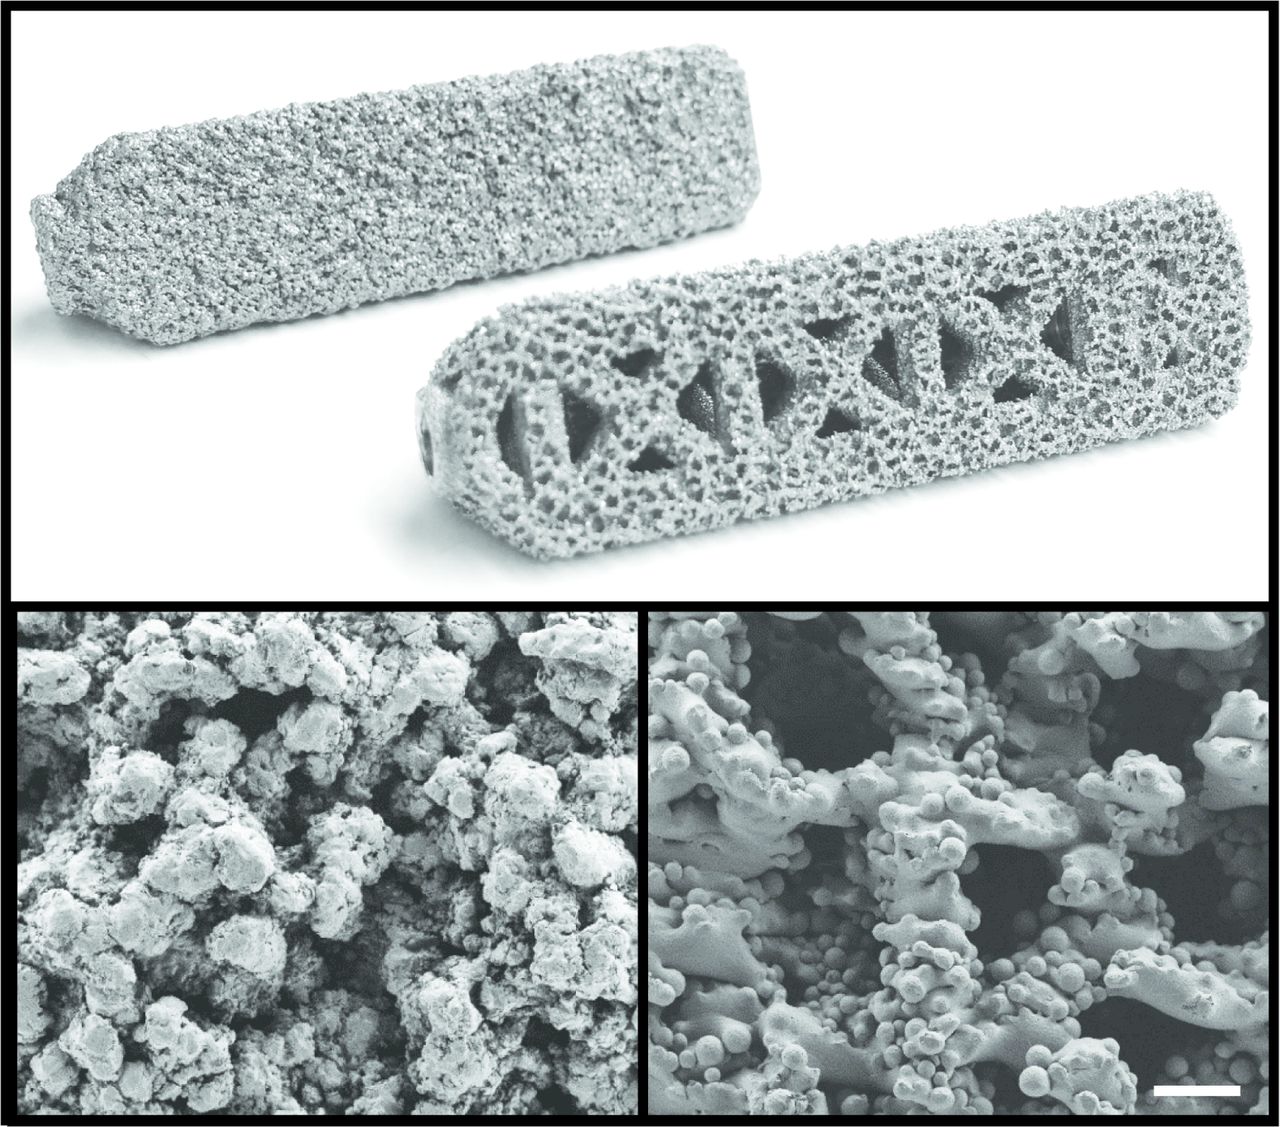
Top: Images of the control TPS-coated implant (back) and additive manufactured (AM) implant (front). All implants were 45 mm long x 7.0 mm inscribed circular diameter. Control implants were comprised of a machined Ti6Al4V ELI core with a 0.75 mm thick commercially pure TPS-coating. AM implants were additive manufactured using Ti6Al4V ELI particles for both the base and porous surface structures. Bottom: Scanning electron microscopy images of the TPS (left) and AM (right) surfaces at 100x. Scale bar = 300 μm.
- Fig. 2
Schematic of device placement, device geometry, and test plan, highlighting how the implant was sectioned for postmortem evaluations, with the “A” section taken from the most closed section and the “B” section taken from the most open section of the additive manufactured (AM) device (A). The red dashed line indicates where the implant was bisected. Note: the solid titanium plasma spray-coated (TPS) implants were placed and processed in the same respective locations. Representative anteroposterior radiographic images at necropsy of TPS (B) and AM (C) implants. Representative lateral radiographic image at necropsy of both implant types (D).
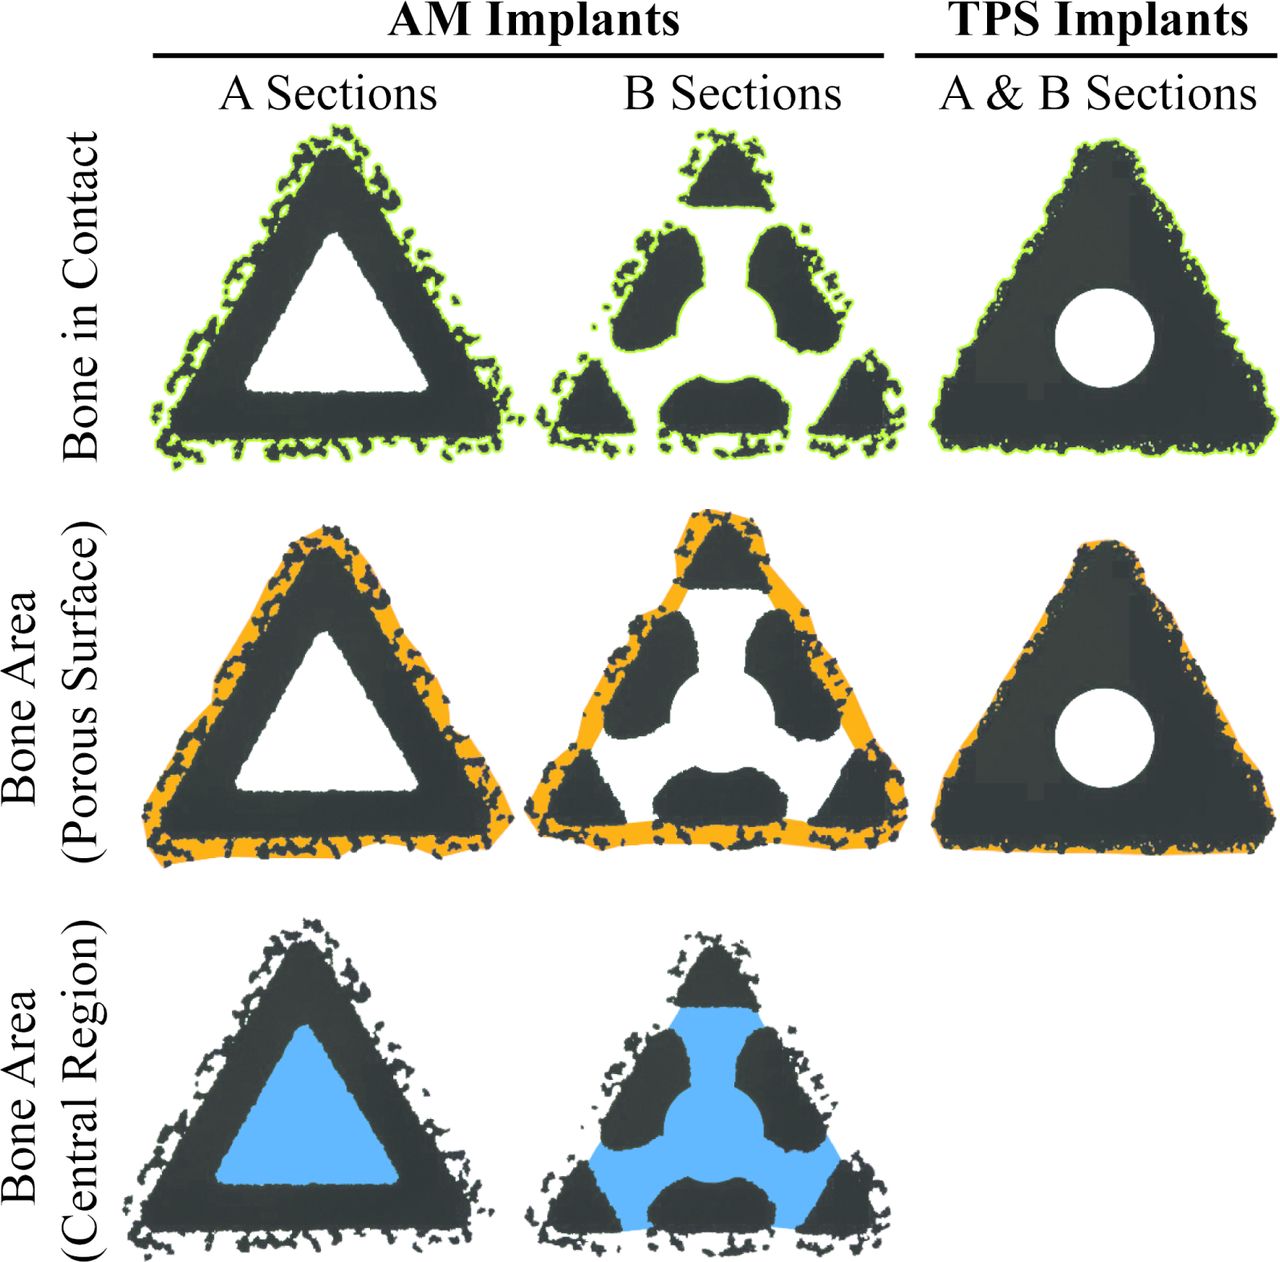
- Fig. 3
Schematic of quantitative histomorphometric regions of interest for A and B sections of AM and TPS implants (Figure 2A). Note: A and B sections for TPS implants have the same cross-section. Top row: Green outline indicates the surface length available for bone in contact (BIC) measurements. Pores within the porous coatings were included in the available surface length. Middle row: Orange area indicates the available area for bone to grow into the porous surface and within the open fenestration between the substrate of the B section of the AM implant and the boundary line drawn between the peaks of the porous coating. The area also includes any open pores within the porous coating available for bone to grow in. Bottom row: Blue area indicates the available area for bone to grow into the central region of the AM implants. This metric was not measured for the TPS implants. AM = additive manufactured, TPS = titanium plasma spray.
- Fig. 4
Biomechanical push-out testing results for ultimate shear strength (A). Dashed line and gray shaded region indicate the average ultimate shear strength and standard deviation, respectively, of bovine cancellous bone.33 Representative gross images of post-push-out samples at 12 weeks show different failure modes (B). TPS implants failed primarily at the bone-implant interface, with some large “spot-welding” patches remaining, while a ~2-3mm ring of bone remained securely attached to all AM groups even after being subjected to ≥ 2500N. Tissue can also be observed growing into the open fenestrations and through the central core of all AM groups. Gross examination at 6 weeks revealed similar findings. Data are represented as mean ± standard deviation, * = p < 0.01 within time-point factor, scale bar = 5 mm. TPS = titanium plasma spray, AM = additive manufactured, AM+HA = additive manufactured with hydroxyapatite, AM+Auto = additive manufactured with autograft.
- Fig. 5
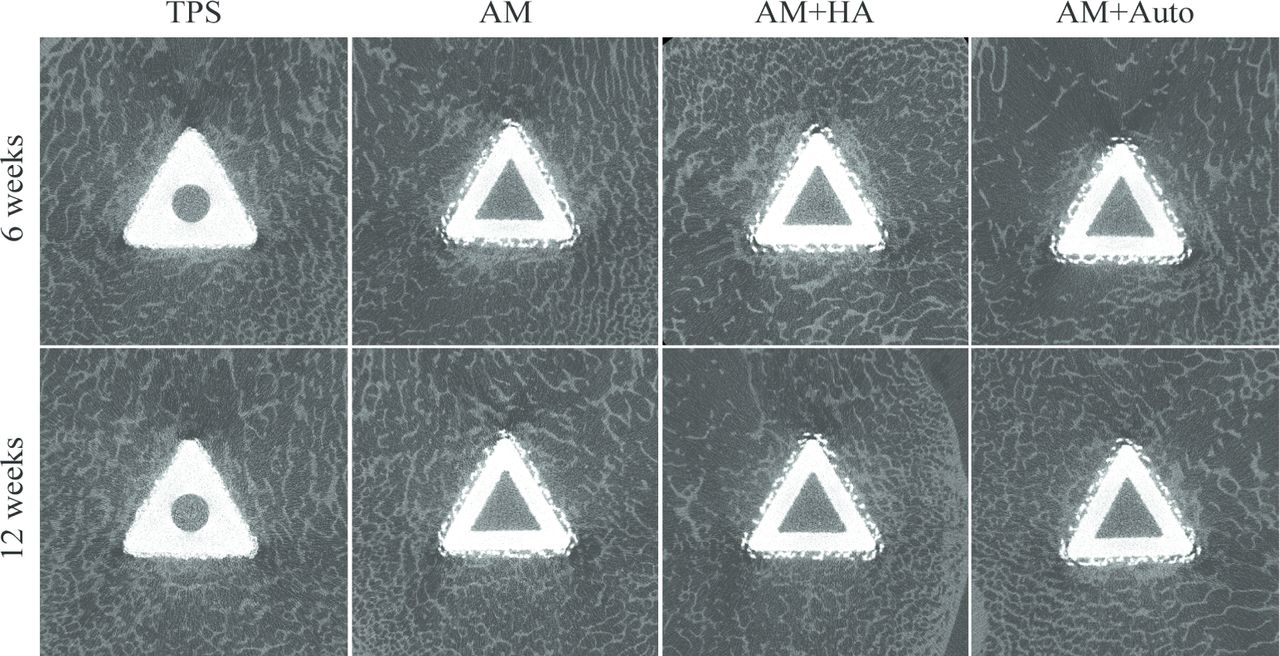
Microcomputed tomographic images of implants at necropsy, corresponding to the “A” histological cross-sections. Peri-implant bone is evident around all implants. Scattering artifact can be observed at implant corners. TPS = titanium plasma spray, AM = additive manufactured, AM+HA = additive manufactured with hydroxyapatite, AM+Auto = additive manufactured with autograft.
- Fig. 6
Representative A and B histological cross-sections from all treatment groups shown at original magnification (1x). Qualitative assessment showed that bone ongrowth/ingrowth to all treatment groups was substantial by 6 weeks and changed with time as the bone matured. Some soft tissue was also seen in contact with the implants, which was mainly composed of a collagen-rich transitional tissue. Bone could also be seen within the central region through the open fenestrations in all AM implant groups. Note that bone forms continuously around the periphery of the implants, and within the open core of the AM implant groups, indicating the dark regions observed under μCT to be artifact. TPS = titanium plasma spray, AM = additive manufactured, AM+HA = additive manufactured with hydroxyapatite, AM+Auto = additive manufactured with autograft.
- Fig. 7
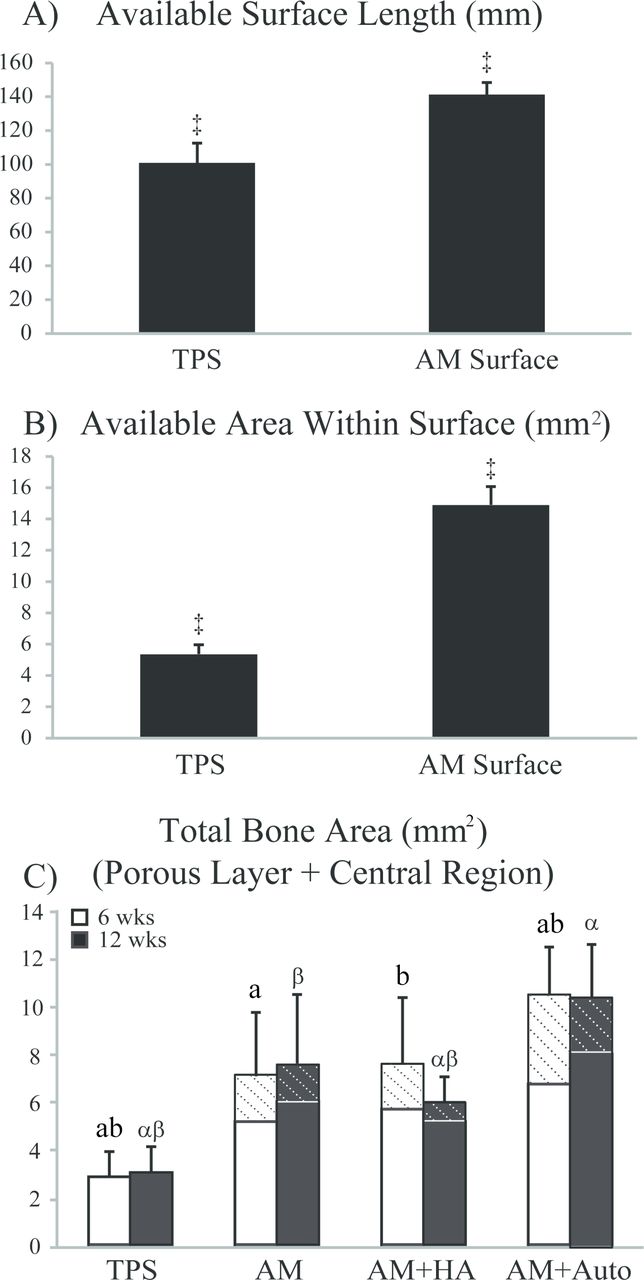
Quantitative histomorphometric results of the outer surface of A sections for available surface length (A) and available area within the surface (B). Results for both metrics were significantly greater in the AM surfaces (averaged across all three AM implant groups) compared to the TPS implants (‡ = p < 0.0001). Bone area (BA) within the porous surface and central region is shown in (C). For AM implant groups, the “hashed” regions of (C) signify the contribution of BA within the central region, whereas the “unhashed” regions signify the contribution of BA within the porous surface. Bars having the same letter are significantly different (p < 0.05). Roman letters refer to 6 week results, while Greek letters refer to 12 week results. Data are represented as mean ± standard deviation. TPS = titanium plasma spray, AM = additive manufactured, AM+HA = additive manufactured with hydroxyapatite, AM+Auto = additive manufactured with autograft.
- Fig. 8
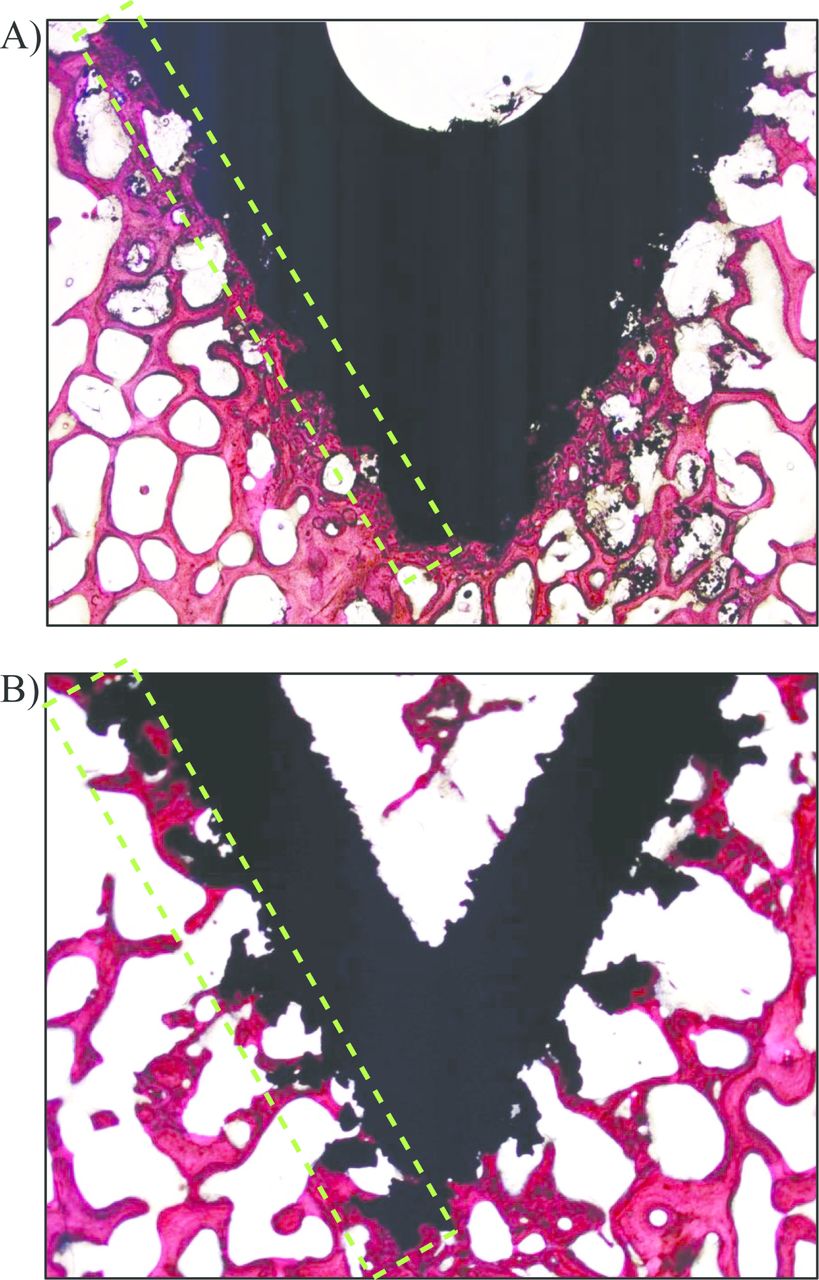
Representative images of titanium plasma spray-coated (TPS) (A) and additive manufactured (AM) (B) implant surfaces (magnification of 7x), with green-dashed region highlighting the differences in porous surface features between the two implant designs. Note that the porous surface of the AM implants is thicker than that of the TPS-coating. New bone can be seen within the open portion of the AM implant. The trabecular morphology around the AM implant is well-organized and aligns with the porous features of the surface, whereas a more compacted morphology is evident around the TPS-coated implant. This may indicate more physiological load-transfer through the AM implant compared to the TPS-coated implant.


Tables
6 weeks 12 weeks TPS AM AM+HA AM+Auto TPS AM AM+HA AM+Auto Peak Push-Out Force (N) 2635±705 2313±1057 2351±535 2961±761 3061±645 3029±710 3450±710 3766±867 Energy to Failure (Nmm) 1497±537 1209±623 1144±513 1660±710 1699±507 1603±549 1971±748 2188±543 TPS = titanium plasma spray, AM = additive manufactured, AM+HA = additive manufactured with hydroxyapatite, AM+Auto = additive manufactured with autograft.
- Table 2
Semi-Quantitative Histological Analysis Results. Data are presented as Median [Range].
6 weeks 12 weeks TPS AM AM+HA AM+Auto TPS AM AM+HA AM+Auto Bone Maturation at Surface 2 [0 – 4] 2 [1 – 3] 2 [1 – 2] 2 [2 – 2] 3 [1 – 4] 2 [1 – 3] 2 [1 – 4] 3 [2 – 4] Bone Maturation within Center N/A 0 [0 – 2] 1 [0 – 2] 1 [0 – 3] N/A 2 [0 – 3] 1 [0 – 2] 2 [0 – 4] TPS = titanium plasma spray, AM = additive manufactured, AM+HA = additive manufactured with hydroxyapatite, AM+Auto = additive manufactured with autograft. Scale is as follows: 0 = <25% lamellar bone, 1 = 25-50% lamellar bone, 2 = 50:50 lamellar to woven bone, 3 = 50-75% lamellar bone, 4 = >75% lamellar bone.
- Table 3
Quantitative Histomorphometric Analysis Results. Data are presented as Mean (Standard Deviation).
6 weeks 12 weeks TPS AM AM+HA AM+Auto TPS AM AM+HA AM+Auto BIC % BIC* 22.52abc (8.00) 12.72a (5.72) 13.86b (2.61) 15.51c (4.26) 25.64 (7.73) 20.07 (1.37) 19.88 (3.88) 21.28 (3.21) Total Surface Length (mm) 180.76 (8.23) 311.78 (13.25) 307.18 (10.4) 304.95 (13) 186.74 (21.06) 272.24 (63.27) 304.41 (10.51) 298.68 (17.38) BIC (mm)* 40.68 (14.44) 39.72 (18.63) 42.63 (8.63) 47.35 (13.47) 48.03 (15.72) 52.81 (16.98) 60.52 (12.12) 63.5 (9.41) BA (Porous Layer) % BA 30.66abc (10.63) 18.4b (7.61) 21.04c (5.59) 22.76a (5.23) 29.47α (9.94) 23.29 (5.29) 18.31α (3.42) 26.48 (6.82) Total Available Area (mm2) 9.37 (0.68) 28.96 (2.57) 27.38 (1.16) 29.55 (1.81) 10.3 (0.69) 27.54 (5.39) 28.54 (1.42) 30.05 (1.17) BA (mm2) 2.88abc (1.02) 5.21a (1.9) 5.75b (1.44) 6.79a (1.94) 3.06αβγ (1.12) 6.00β (2.59) 5.23αγ (1.05) 7.96 α (2.09) BA (Central Region) % BA* N/A 4.29b (1.74) 4.11a (4.32) 9.52ab (3.13) N/A 3.29 (1.88) 1.73β (1.22) 4.58 α (1.47) Total Available Area (mm2) N/A 46.19 (5.55) 48.2 (3.6) 41.62 (8.74) N/A 45.09 (13.89) 49.21 (1.73) 49.99 (3.04) BA (mm2)* N/A 2 (0.83) 1.87 (1.9) 3.77 (0.69) N/A 1.57 (0.99) 0.85β (0.61) 2.28α (0.72) Data connected with the same letter are significantly different (p < 0.05). Roman letters refer to 6 week results, while Greek letters refer to 12 week results.
↵* = p < 0.05 within time-point factor. TPS = titanium plasma spray, AM = additive manufactured, AM+HA = additive manufactured with hydroxyapatite, AM+Auto = additive manufactured with autograft, BIC = bone-in-contact, BA = bone area.
In this issue


Jump to section
Related Articles
Cited By...
- No citing articles found.