


Article Figures & Data
Figures
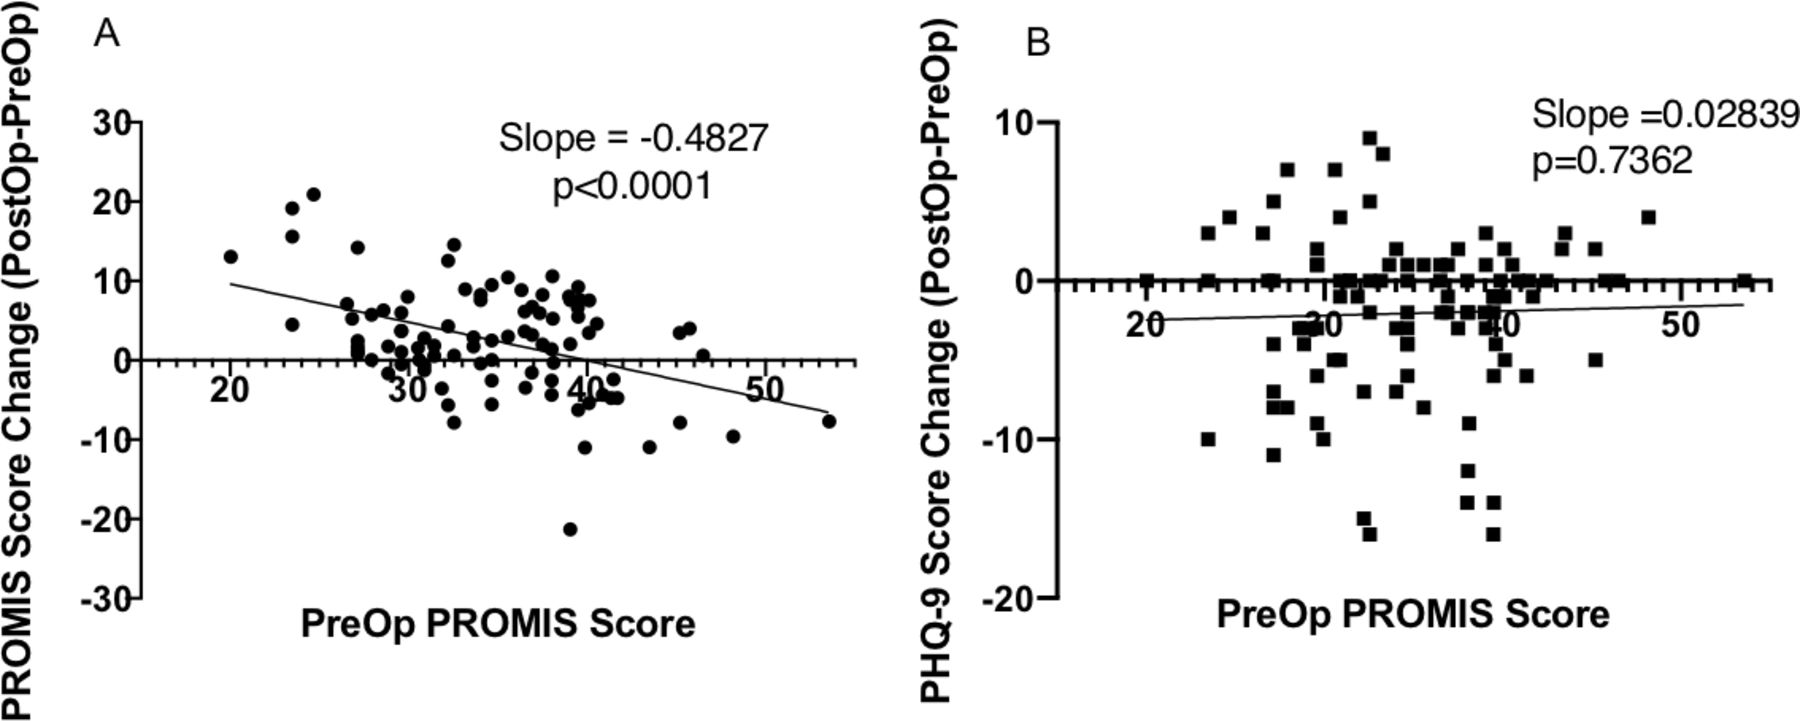
- Figure 1
6-week (A) Patient-Reported Outcomes Measurement Information System Physical Function (PROMIS PF) and (B) Patient Health Questionnaire-9 (PHQ-9) improvement plotted against preoperative PROMIS PF scores. PROMIS score change slope was −0.4827 (P < 0.0001), and PHQ-9 score change slope was 0.0284 (P = 0.7362).
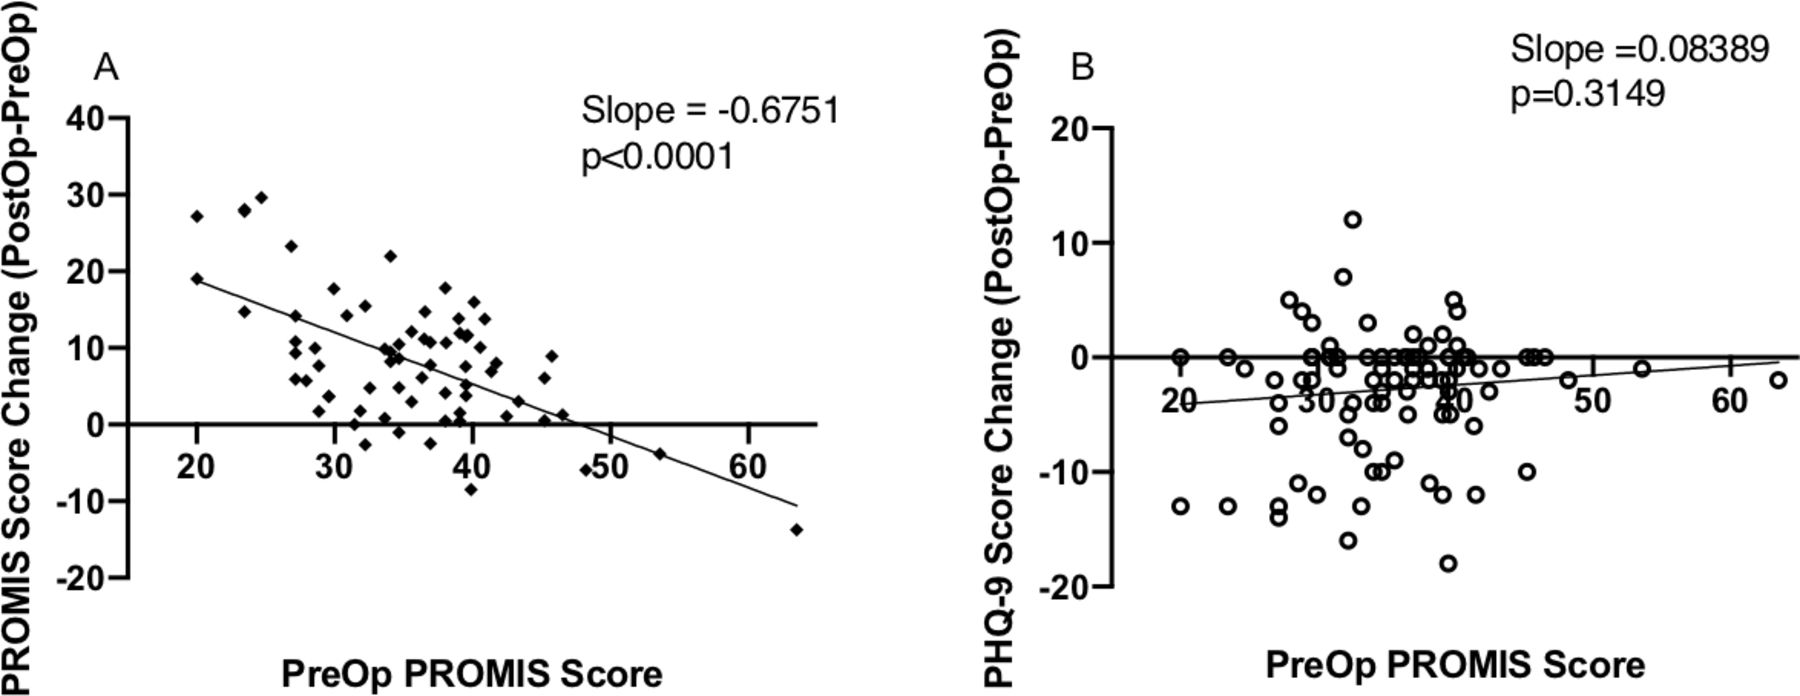
- Figure 2
12-week (A) Patient-Reported Outcomes Measurement Information System Physical Function (PROMIS PF) and (B) Patient Health Questionnaire-9 (PHQ-9) improvement plotted against preoperative PROMIS PF scores. PROMIS score change slope was −0.7039 (P < 0.0001), and PHQ-9 score slope was 0.8258 (P = 0.2661).
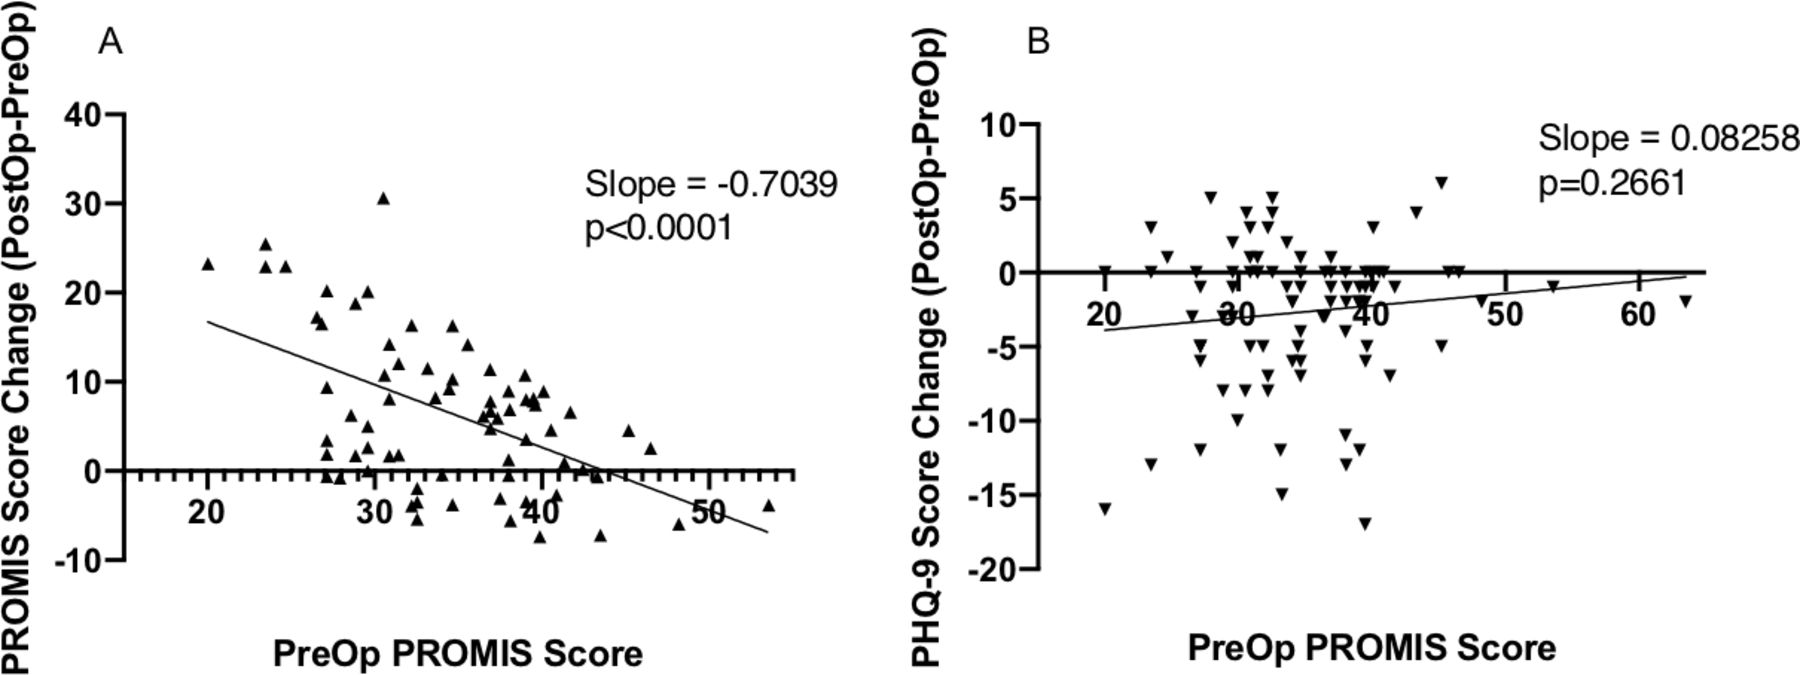
- Figure 3
6-month (A) Patient-Reported Outcomes Measurement Information System Physical Function (PROMIS PF) and (B) Patient Health Questionnaire-9 (PHQ-9) improvement plotted against preoperative PROMIS PF scores. PROMIS score change slope was −0.6751 (P < 0.0001), and PHQ-9 score change slope was 0.08389 (P = 0.3149).
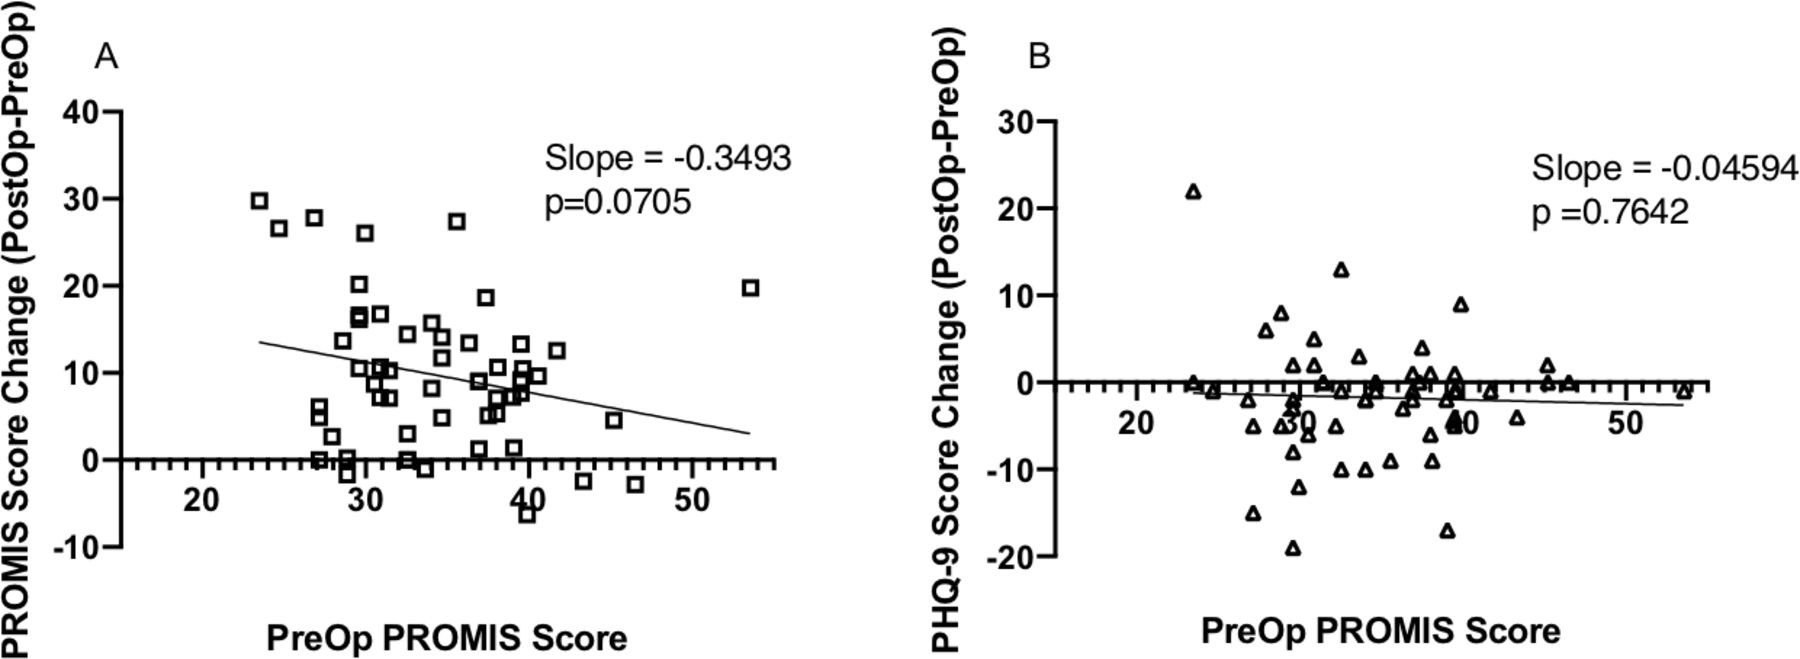
- Figure 4
1-year (A) Patient-Reported Outcomes Measurement Information System Physical Function (PROMIS PF) and (B) Patient Health Questionnaire-9 (PHQ-9) improvement plotted against preoperative PROMIS PF scores. PROMIS score change slope was −0.3493 (P = 0.0705), and PHQ-9 score change slope was −0.0459 (P = 0.7642).


Tables
Demographic Total
(N = 119)PROMIS ≥35
(n = 55)PROMIS <35
(n = 64)P Valuea Age (mean + SD) 52.2 ± 10.7 51.7 ± 11.6 52.6 ± 10.0 0.619 Gender, n (%) 0.002 Female 55 (46.2%) 17 (31.0%) 38 (59.4%) Male 64 (53.8%) 38 (69.0%) 26 (40.6%) Body mass index, n (%) 0.002 Nonobese (<30 kg/m2) 62 (52.1%) 37 (67.3%) 25 (39.1%) Obese (≥30 kg/m2) 57 (47.9%) 18 (32.7%) 39 (60.9%) Smoking status, n (%) 0.996 Non-smoker 106 (89.1%) 49 (89.1%) 57 (89.1%) Smoker 13 (10.9%) 6 (10.9%) 7 (10.9%) Insurance coverage, n (%) 0.387 Private or WC 115 (96.6%) 54 (98.2%) 61 (95.3%) Medicare/Medicaid 4 (3.4%) 1 (1.8%) 3 (4.7%) Ageless CCI, mean ± SD 0.96 ± 1.0 0.84 ± 1.1 1.06 ± 1.0 0.233 Preoperative PHQ-9, mean ± SD 6.9 ± 6.6 5.4 ± 6.0 8.3 ± 6.8 0.018 Preoperative diagnoses, n (%)b Myocardial infarction 3 (2.5%) 2 (3.6%) 1 (1.6%) 0.472 Uncomplicated diabetes 10 (8.4%) 3 (5.5%) 7 (11.0%) 0.282 Complicated diabetes 2 (1.7%) 1 (1.8%) 1 (1.6%) 0.914 Hypertension 39 (32.8%) 16 (29.1%) 23 (36.0%) 0.428 Neurologic disease 2 (1.7%) 1 (1.8%) 1 (1.6%) 0.914 Arthritis 22 (18.5%) 7 (12%) 15 (23.4%) 0.133 Malignancy 12 (10.1%) 5 (9.1%) 7 (11.0%) 0.739 Boldface indicates statistical significance (P < 0.05).
aP value was calculated using Student t test (continuous), χ 2 (categorical), or Fisher exact test (categorical).
bThere were no patients in our study with a recorded medical history of AIDS, paraplegia, congestive heart failure, peripheral vascular disease, metastatic disease, liver disease, renal failure, chronic obstructive pulmonary disease, or gastrointestinal bleeds.
CCI, Charlson Comorbidity Index; PROMIS, Patient-Reported Outcomes Measurement Information System; SD, standard deviation; WC, workers compensation.
Characteristic PROMIS ≥35
(n = 55)PROMIS <35
(n = 64)P Valuea Operative timeb (min), mean ± SD 121.8 ± 19.4 (n = 54) 128.0 ± 22.3 0.133 Estimated blood loss (mL), mean ± SD 43.3 ± 19.9 54.5 ± 54.9 0.165 Length of hospital stay (h), mean ± SD 23.2 ± 17.7 (n = 54) 34.4 ± 19.9 0.002 Discharge day (%) 0.003 POD 0 22 (40.0%) 7 (10.9%) POD 1 26 (47.3%) 38 (59.4%) POD 2 6 (10.9%) 14 (21.9%) POD 3 0 (0%) 3 (4.7%) POD 4 1 (1.8%) 2 (3.1%) Boldface indicates statistical significance (P < 0.05).
aP value was calculated using Student t test (continuous), χ2 analysis (categorical), or Fisher exact test (categorical).
bOperative time was measured from skin incision to skin closure.
POD, postoperative day; PROMIS, Patient-Reported Outcomes Measurement Information System.
Time Period PROMIS ≥35
Mean ± SD (n)PROMIS <35
Mean ± SD (n)P Valuea PROMIS Preoperative 40.2 ± 4.7 (55) 30.2 ± 3.5 (64) <0.001 6 weeks 40.8 ± 6.5 (43) 34.0 ± 5.6 (48) <0.001 12 weeks 43.5 ± 5.2 (33) 39.0 ± 8.6 (38) 0.011 6 months 46.7 ± 5.8 (36) 40.6 ± 7.2 (33) <0.001 1 year 48.3 ± 8.1 (24) 41.0 ± 8.3 (31) 0.002 PHQ-9 Preoperative 5.4 ± 6.0 (55) 8.3 ± 6.8 (64) 0.018 6 weeks 3.8 ± 5.4 (46) 6.2 ± 5.7 (54) 0.029 12 weeks 2.4 ± 3.7 (38) 4.5 ± 4.4 (53) 0.017 6 months 2.8 ± 4.2 (45) 4.7 ± 5.3 (46) 0.056 1 year 2.8 ± 4.4 (24) 4.7 ± 5.7 (31) 0.180 Boldface indicates statistical significance (P < 0.05).
aP value was calculated using Student t test (continuous).
PF, Physical Function; PHQ-9, Patient Health Questionnaire-9; PROMIS, Patient-Reported Outcome Measurement Information System.
Time Period Postoperative Improvement
Mean ± SD (n)
PROMIS ≥35Postoperative Improvement
Mean ± SD (n)
PROMIS <35R 2 P Valuea PROMIS Preoperative — — — — 6 weeks 0.85 ± 7.0 (43) 4.0 ± 6.2 (54) 0.054 0.026 12 weeks 3.3 ± 5.8 (33) 9.2 ± 9.6 (38) 0.120 0.003 6 months 5.8 ± 7.1 (36) 11.1 ± 9.0 (33) 0.101 0.008 1 year 8.3 ± 7.4 (24) 10.7 ± 8.9 (31) 0.019 0.305 PHQ-9 Preoperative __ __ __ __ 6 weeks −2.2 ± 4.6 (46) −1.9 ± 5.4 (54) 0.001 0.808 12 weeks −2.4 ± 4.5 (38) −2.8 ± 5.1 (53) 0.001 0.712 6 months −2.4 ± 4.5 (45) −3.2 ± 6.1 (46) 0.005 0.490 1 year −2.0 ± 5.0 (24) −1.5 ± 7.9 (31) 0.001 0.807 Boldface indicates statistical significance (P < 0.05).
aP value was calculated using linear regression
PHQ-9, Patient Health Questionnaire-9; PROMIS, Patient-Reported Outcomes Measurement Information System.
Effect Size 95% CI R 2 P Valuea Delta PHQ-9 Preoperative — — — — 6 weeks −0.143 [−0.030, 0.012] 0.038 0.071 12 weeks −0.117 [−0.25,−0.015] 0.047 0.083 6 months −0.144 [−0.28,−0.005] 0.061 0.042 1 year −0.225 [−0.42,−0.259] 0.101 0.028 Boldface indicates statistical significance (P < 0.05).
aP value was calculated using linear regression.
PHQ-9, Patient Health Questionnaire-9; PROMIS PF, Patient-Reported Outcomes Measurement Information System Physical Function.
- Table 6
Postoperative improvement over predetermined time periods for other patient-reported outcomes.
Postoperative Improvement
Mean ± SD (n)
PROMIS ≥35P Valuea Postoperative Improvement
Mean ± SD (n)
PROMIS ≥35P Valuea ODI Preoperative — — — — 6 weeks 9.7 ± 17.7 (49) <0.001 8.4 ± 18.2 (57) 0.001 12 weeks 13.4 ± 14.6 (42) <0.001 14.5 ± 21.1 (55) <0.001 6 months 17.1 ± 15.0 (47) <0.001 19.7 ± 20.3 (44) <0.001 1 year 19.5 ± 10.8 (20) <0.001 18.8 ± 27.1 (26) <0.001 VAS Back Preoperative — — — — 6 weeks 2.9 ± 2.7 (47) <0.001 2.3 ± 3.2 (57) <0.001 12 weeks 2.9 ± 2.6 (41) <0.001 2.7 ± 3.1 (55) <0.001 6 months 2.9 ± 3.1 (46) <0.001 2.2 ± 3.6 (43) <0.001 1 year 4.1 ± 3.1 (20) <0.001 2.8 ± 4.5 (26) 0.004 VAS Leg Preoperative — — — — 6 weeks 2.6 ± 3.1 (47) <0.001 3.2 ± 3.0 (57) <0.001 12 weeks 2.9 ± 2.9 (42) <0.001 3.7 ± 3.2 (55) <0.001 6 months 2.9 ± 3.4 (47) <0.001 3.7 ± 3.3 (43) <0.001 1 year 3.7 ± 3.0 (20) <0.001 2.7 ± 4.0 (26) 0.002 SF-Physical Preoperative — — — — 6 weeks −2.5 ± 9.9 (45) <0.001 −2.2 ± 7.2 (57) <0.001 12 weeks −3.1 ± 11.0 (36) 0.099 −6.9 ± 10.8 (51) <0.001 6 months −7.6 ± 10.8 (38) <0.001 −8.6 ± 10.7 (37) <0.001 1 year −12.0 ± 9.5 (22) <0.001 −9.8 ± 13.0 (33) <0.001 SF-Mental Preoperative — — — — 6 weeks −3.7 ± 9.1 (45) <0.001 −1.6 ± 8.4 (57) <0.001 12 weeks −3.5 ± 7.7 (36) 0.011 −2.6 ± 8.4 (51) 0.036 6 months −1.9 ± 5.7 (38) 0.046 −4.3 ± 8.8 (37) 0.005 1 year −3.1 ± 10.4 (22) 0.179 −3.0 ± 8.9 (33) 0.067 Boldface indicates statistical significance.
aP value was calculated using paired Student t test (continuous).
ODI, Oswestry Disability Index; PHQ-9, Patient Health Questionnaire-9; SD, standard deviation; SF, Short Form; VAS, visual analog scale.
In this issue


Jump to section
Related Articles
Cited By...
- No citing articles found.